Crypto Price Analysis & Overview April 23rd: Bitcoin, Ethereum, Ripple, Cardano, and Solana
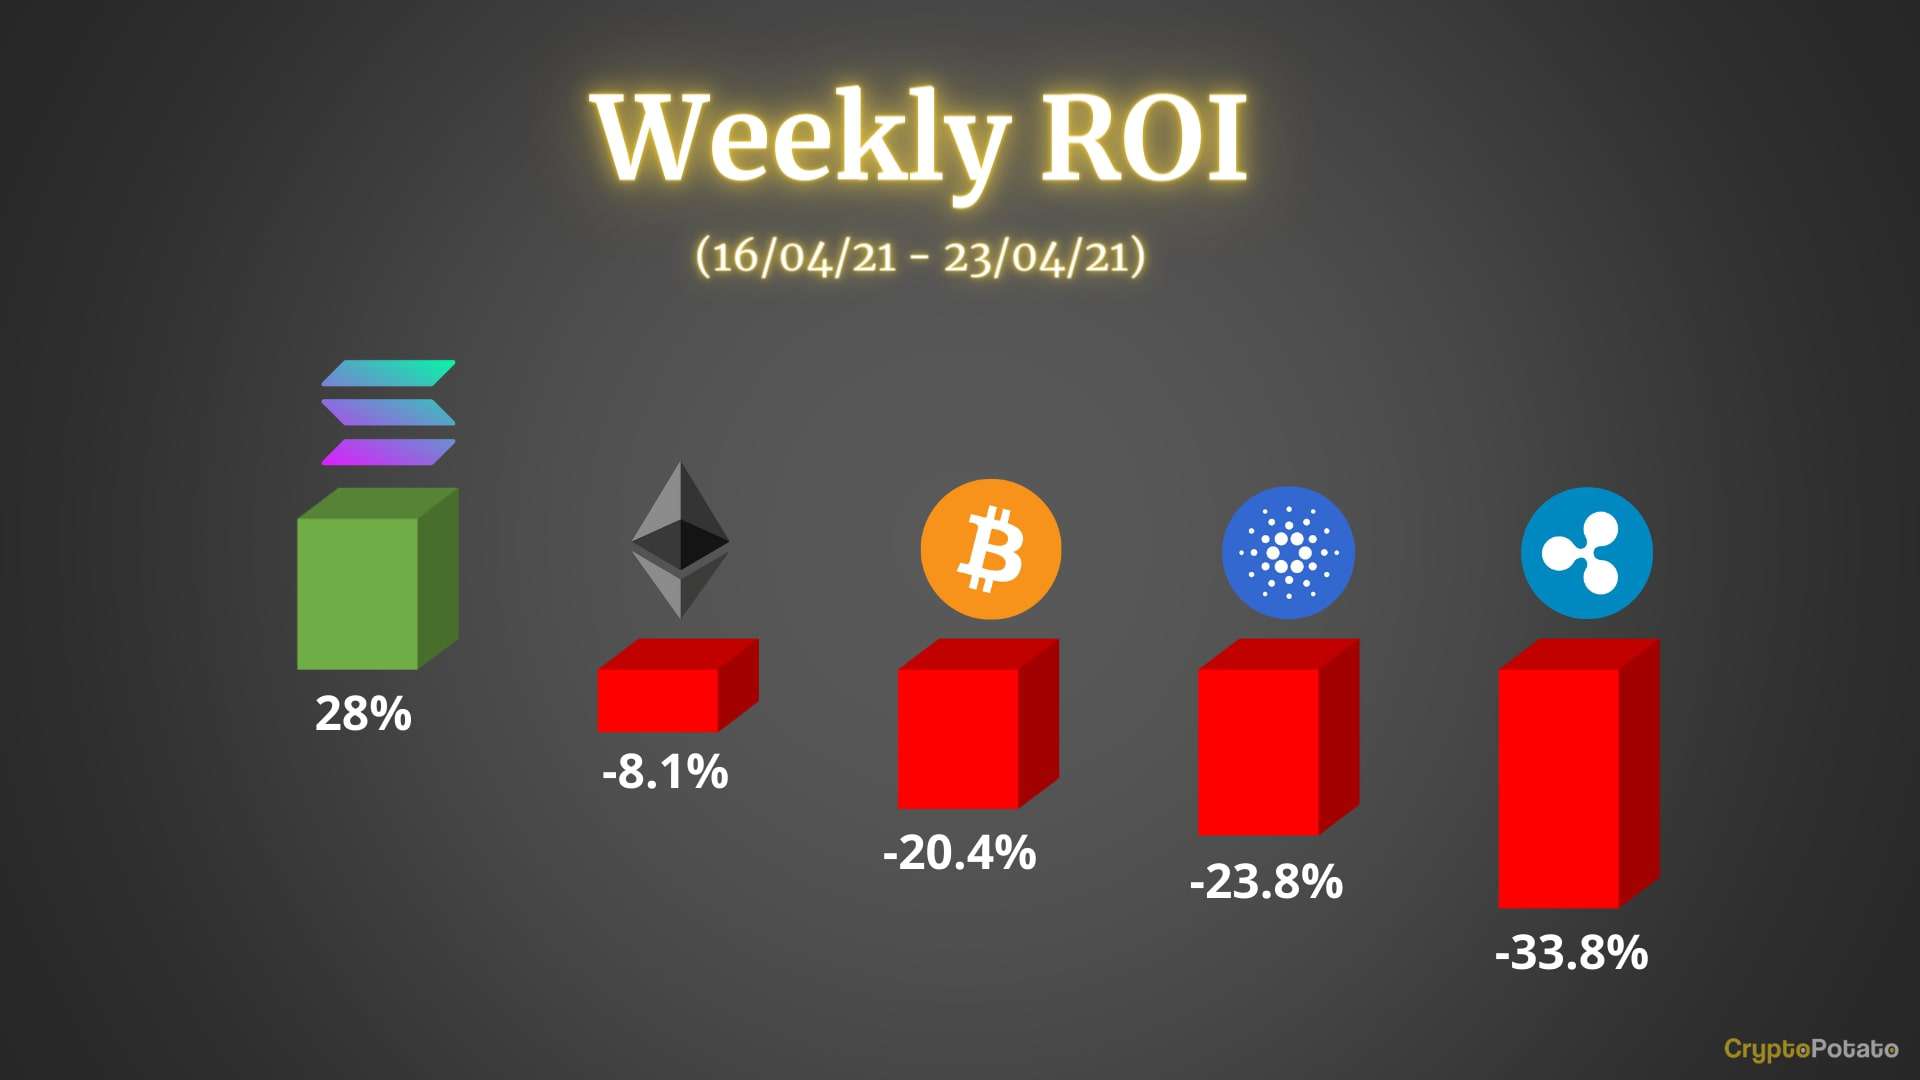
It was a red week all over the cryptocurrency market. Almost everything, with a few exceptions, declined substantially as the total market cap slipped below $2 trillion.
Bitcoin
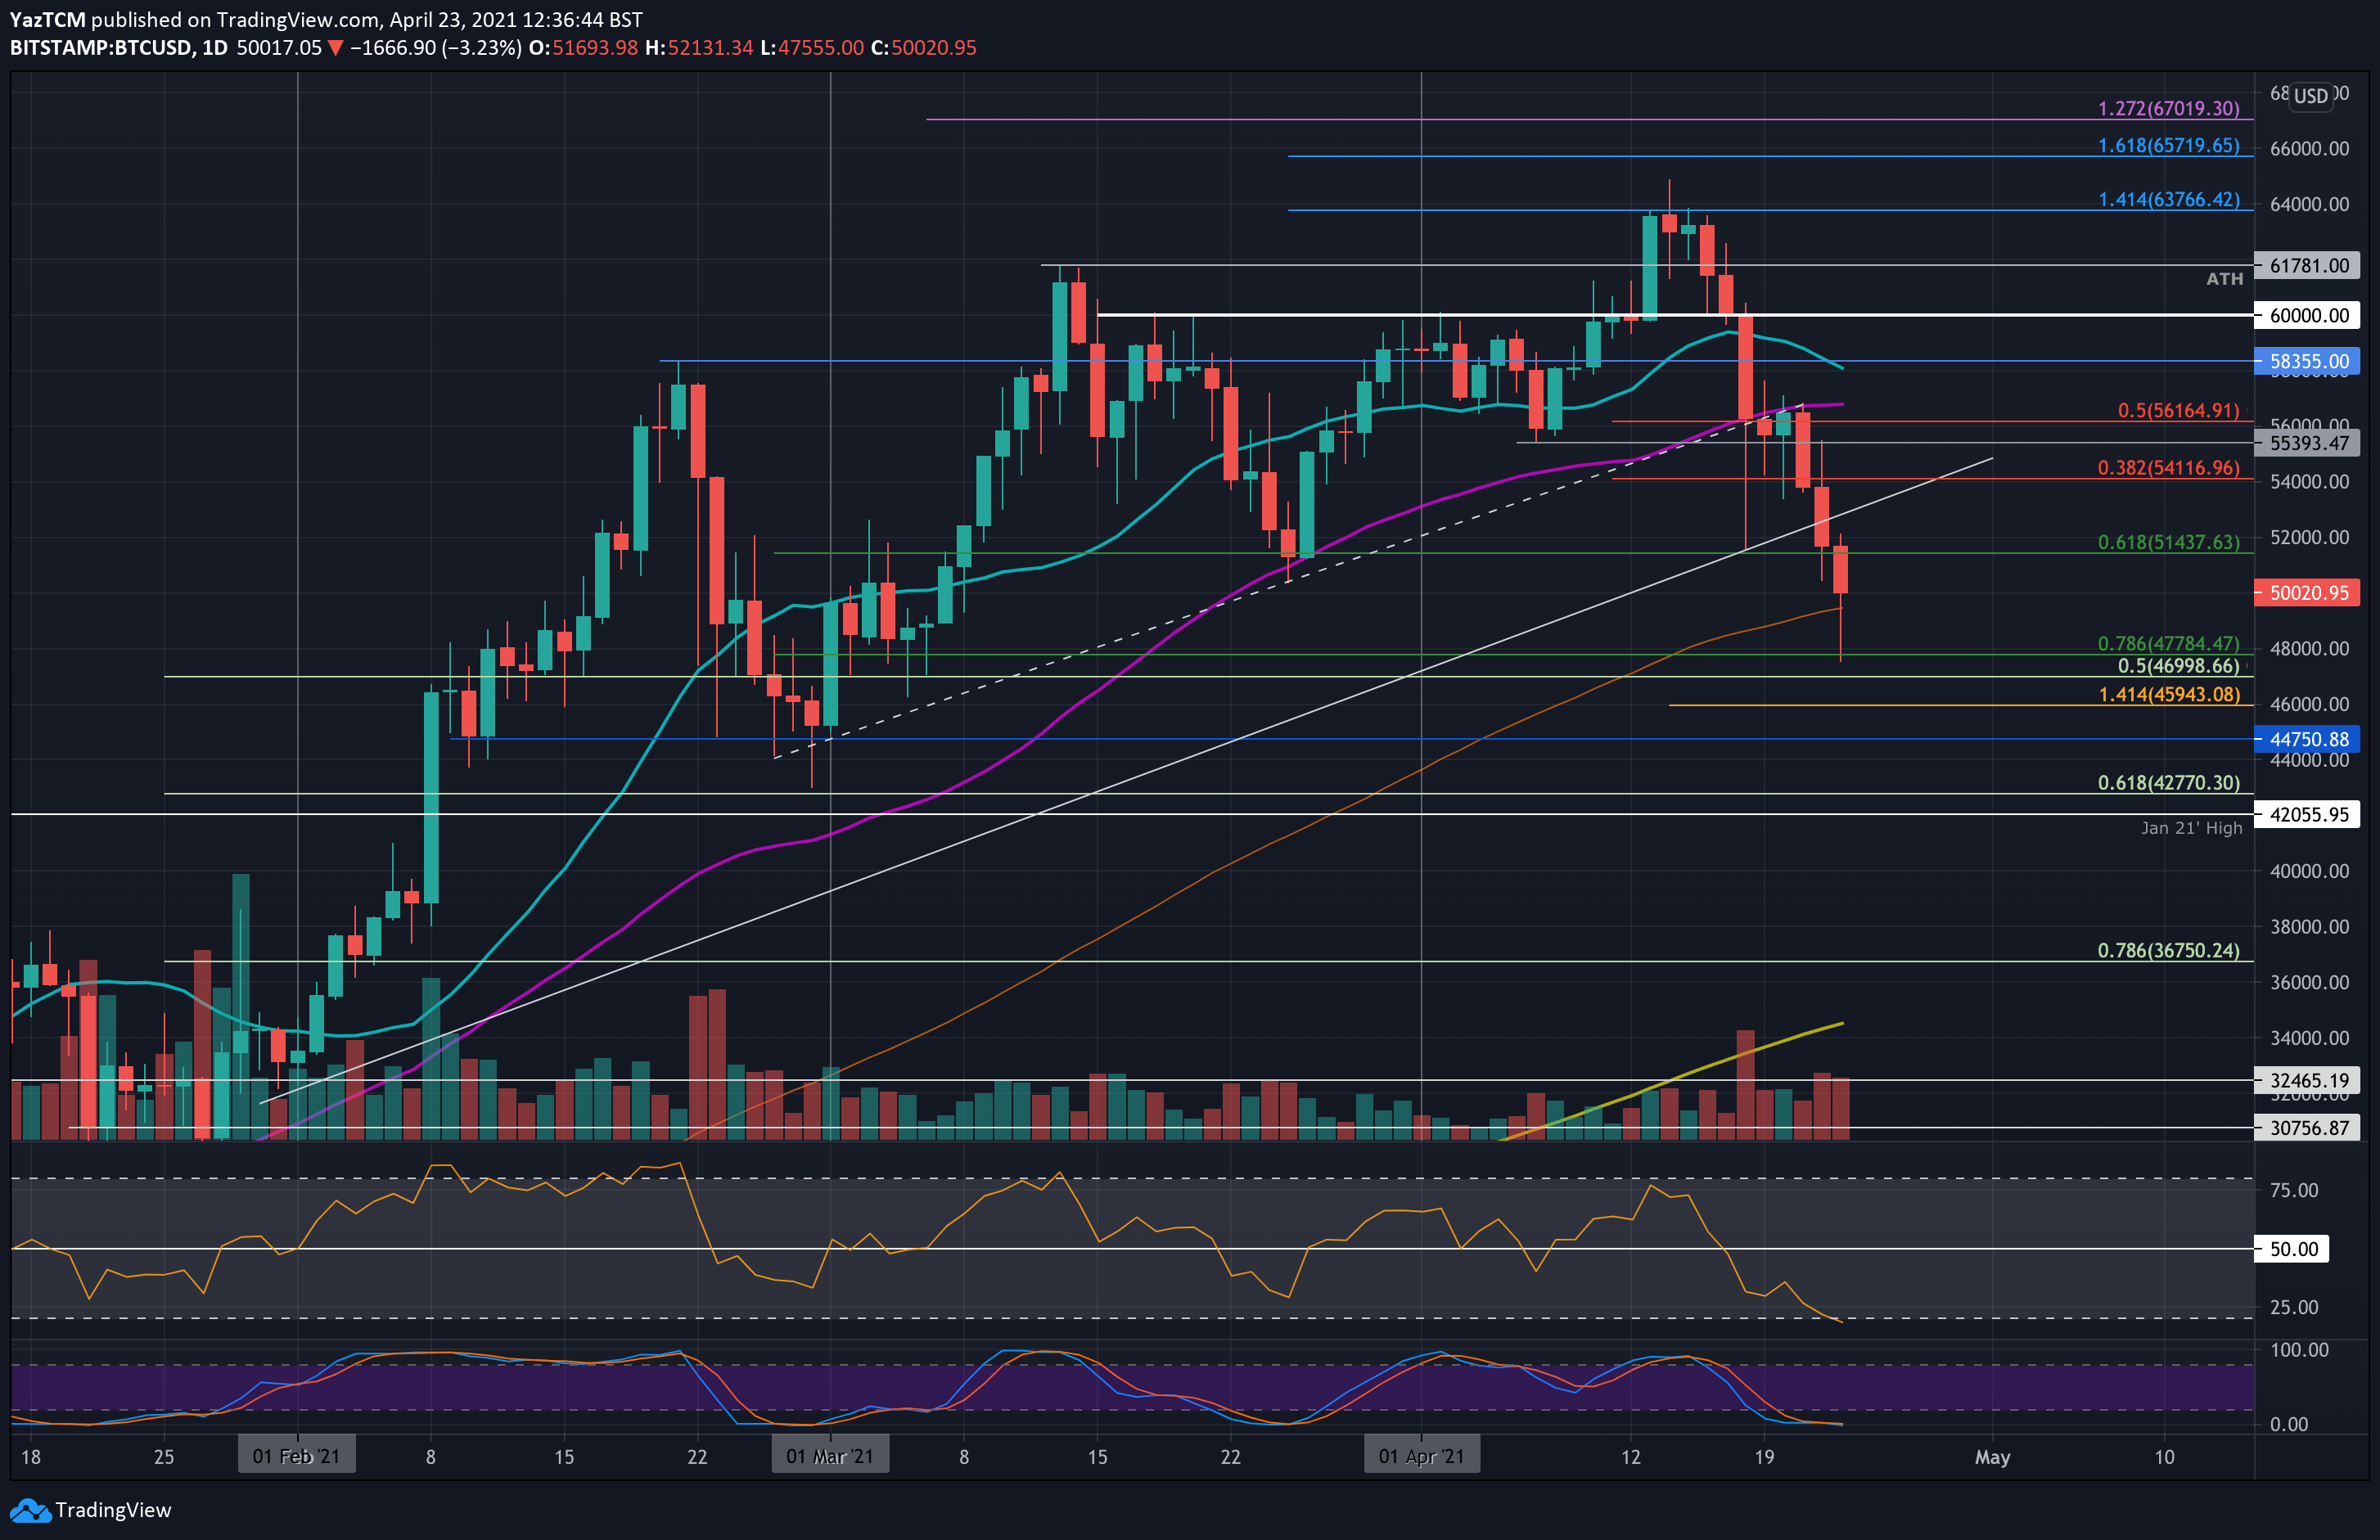
Bitcoin saw a turbulent week in which the price dropped by a steep 20% to break beneath $50,000 and reach as low as $47,500 today. The cryptocurrency fell beneath $60,000 at the start of the week as it saw a large spike lower in which it dropped to the $51,440 support (.618 Fib).
It managed to rebound from there by the end of the day and closed Sunday’s candle above the 50-days MA level. Unfortunately, bitcoin fell beneath the 50-days MA on Monday and could not recover above it throughout the week. On Wednesday, bitcoin fell from the 50-days MA as it slipped beneath $54,000.
It continued lower yesterday as it closed at around $51,440 (.618 Fib). Today, the price decline continued for BTC, in which it dropped as low as $47,500. It has since recovered slightly and is now trading above $50,000 as it battles to hold support at the 100-days MA there.
Looking ahead, the first support beneath the 100-days MA lies at today’s low of $47,500. This is followed by $47,000 (long term .5 Fib), $45,950 (downside 1.414 Fib Extension), $4,750, $42,770 (long term .618 Fib), and $42,000 (Jan 21’ Highs).
On the other side, the first strong resistance lies at $50,000. This is followed by $52,000, $53,500 (ascending trend line), $51,120 (bearish .382 Fib), $55,400, and $56,165 (bearish .5 Fib).
Ethereum
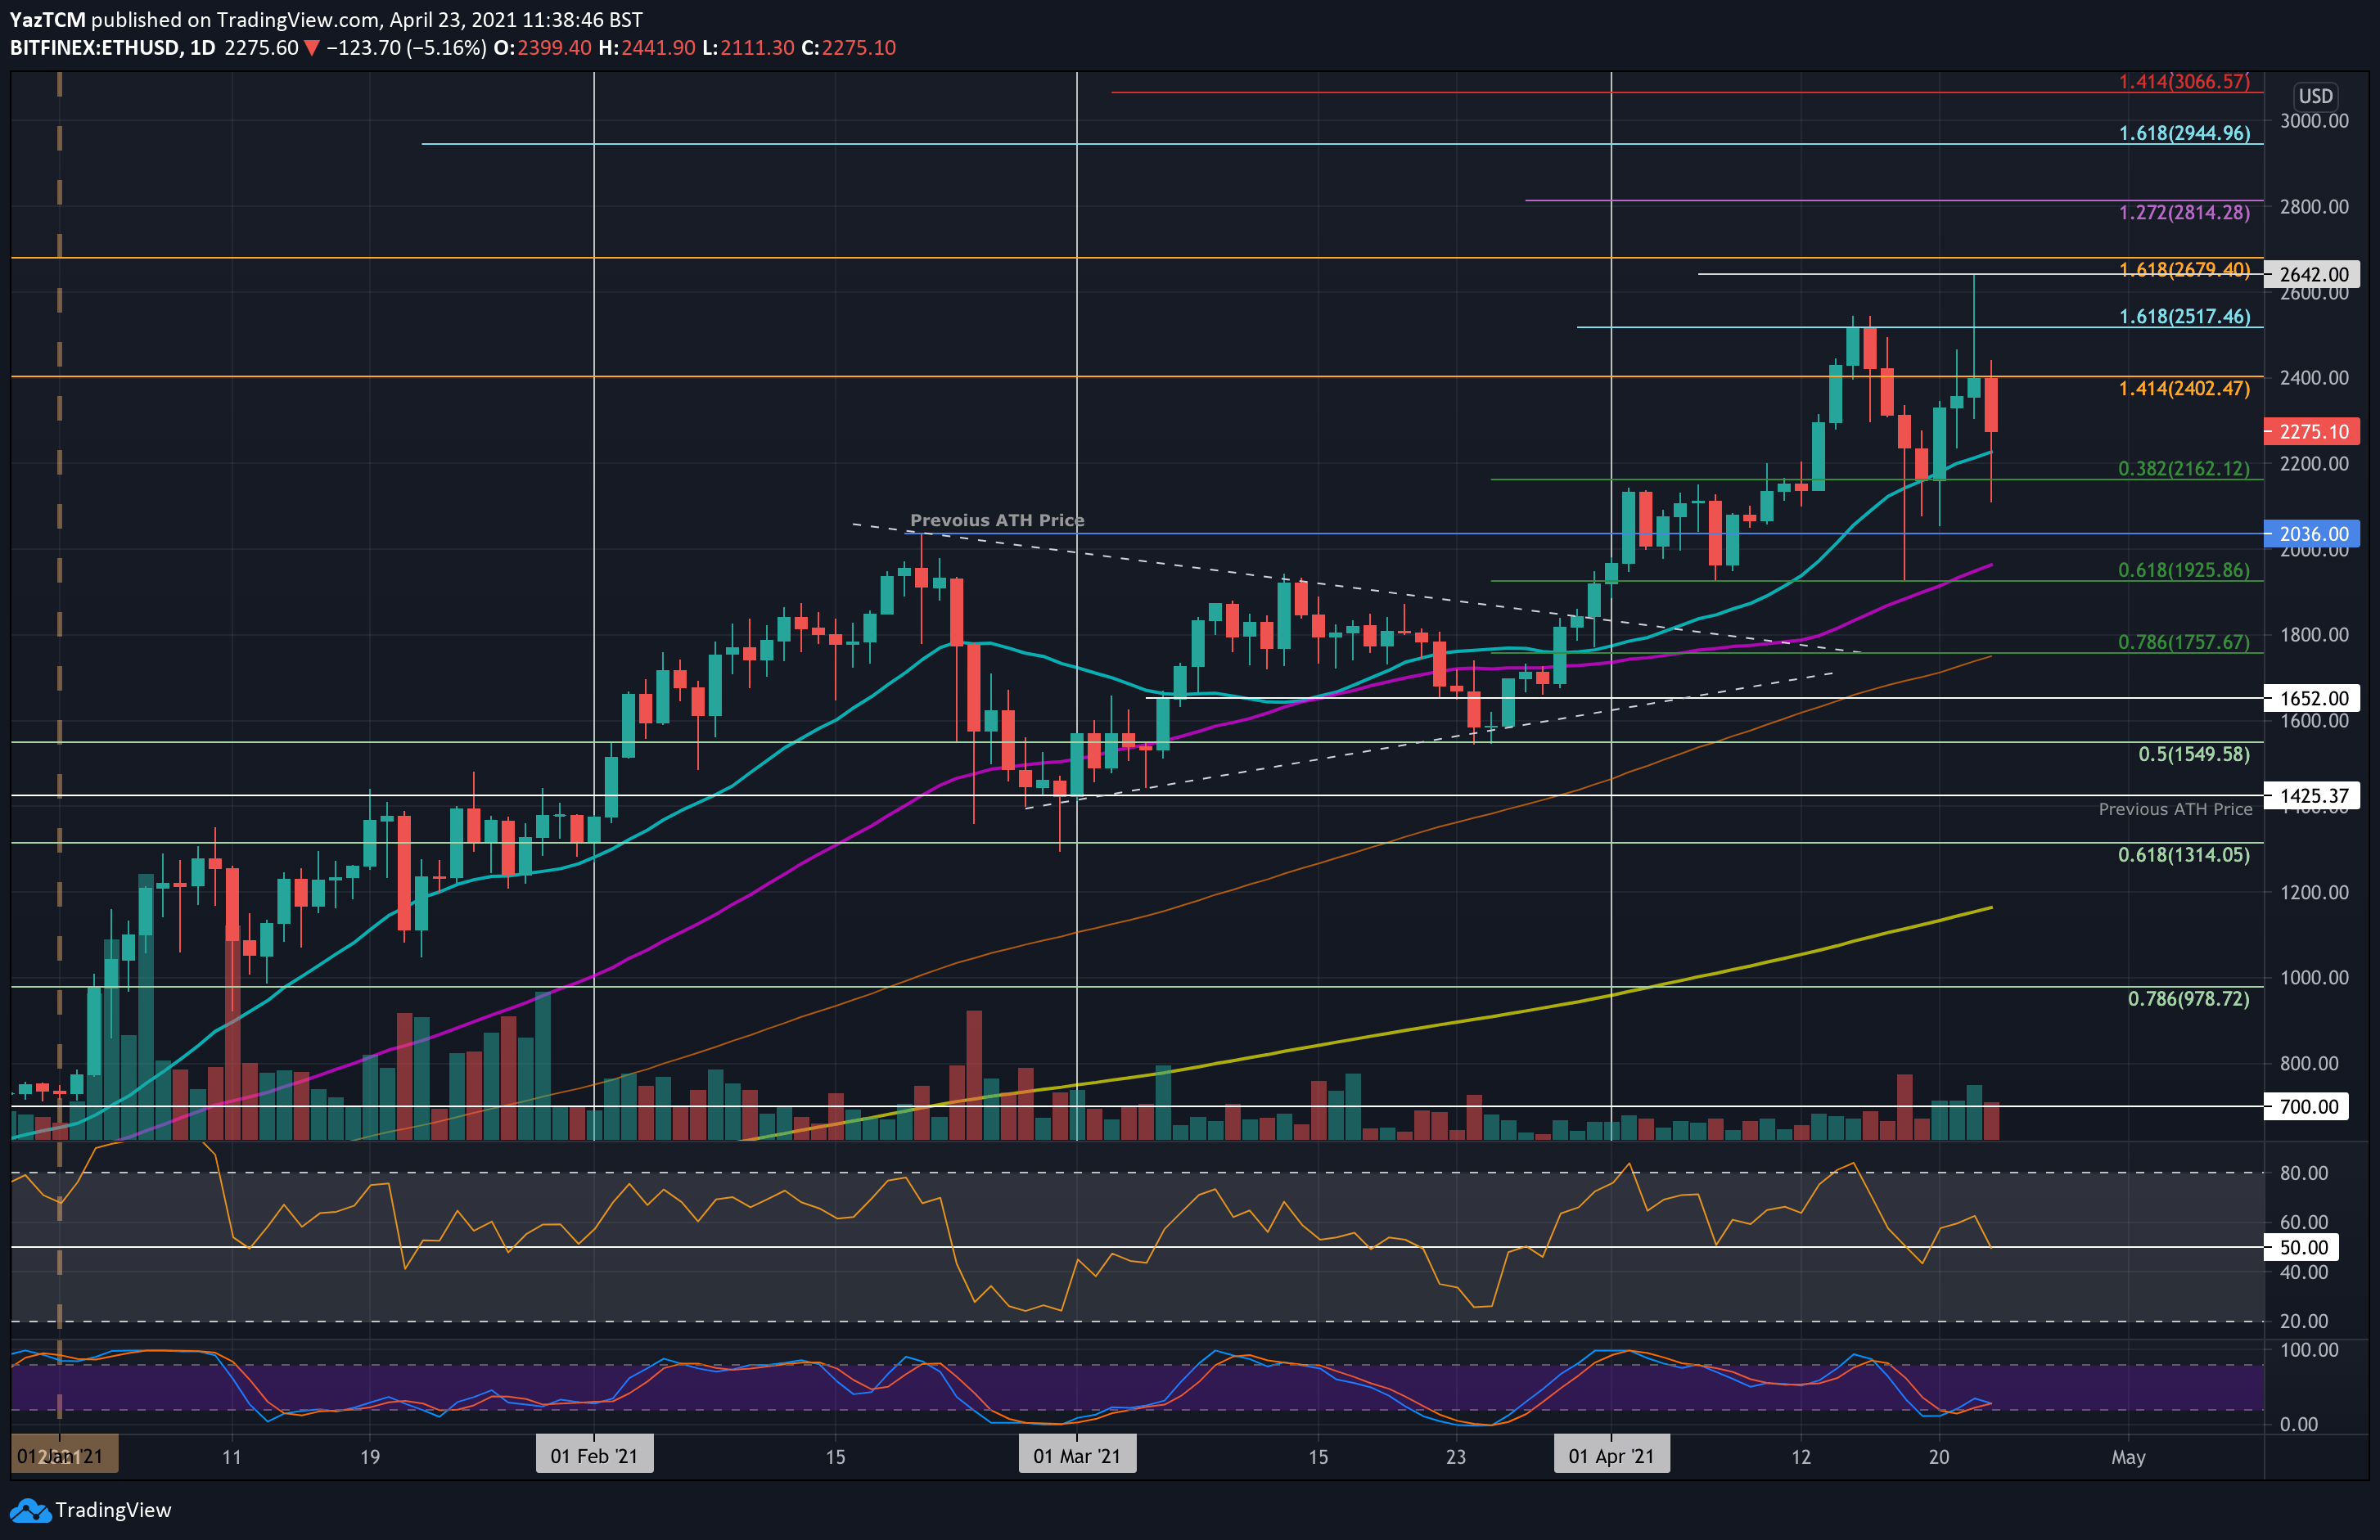
Ethereum saw a smaller 10% price drop throughout the week as it currently trades at $2275. The cryptocurrency has been rangebound between $2400 and $2162 for the past six days and must close a daily candle above the range to dictate the next direction for the market.
Earlier in the week, ETH did slip lower on Sunday as it spiked beneath $2000 to reach $1925 (.618 Fib). It quickly rebounded from there and established strong support at $2162 (.382 Fib) during the week.
Yesterday, ETH also managed to create a new ATH price at $2642 but was unable to close a daily candle above $2402 (1.414 Fib Extension).
Looking ahead, the first resistance lies at $2402. This is followed by $2517 (1.618 Fib Extension) and $2642. If the buyers break the ATH, resistance lies at $2815 (1.272 Fib Extension – purple), $2945 (1.618 Fib Extension – blue), $3000, and $3066.
On the other side, the first support lies at $2200 (20-days MA). This is followed by $2162 (.382 Fib), $2036, $1925 (.618 Fib), and $1757 (.786 Fib & 100-days MA).
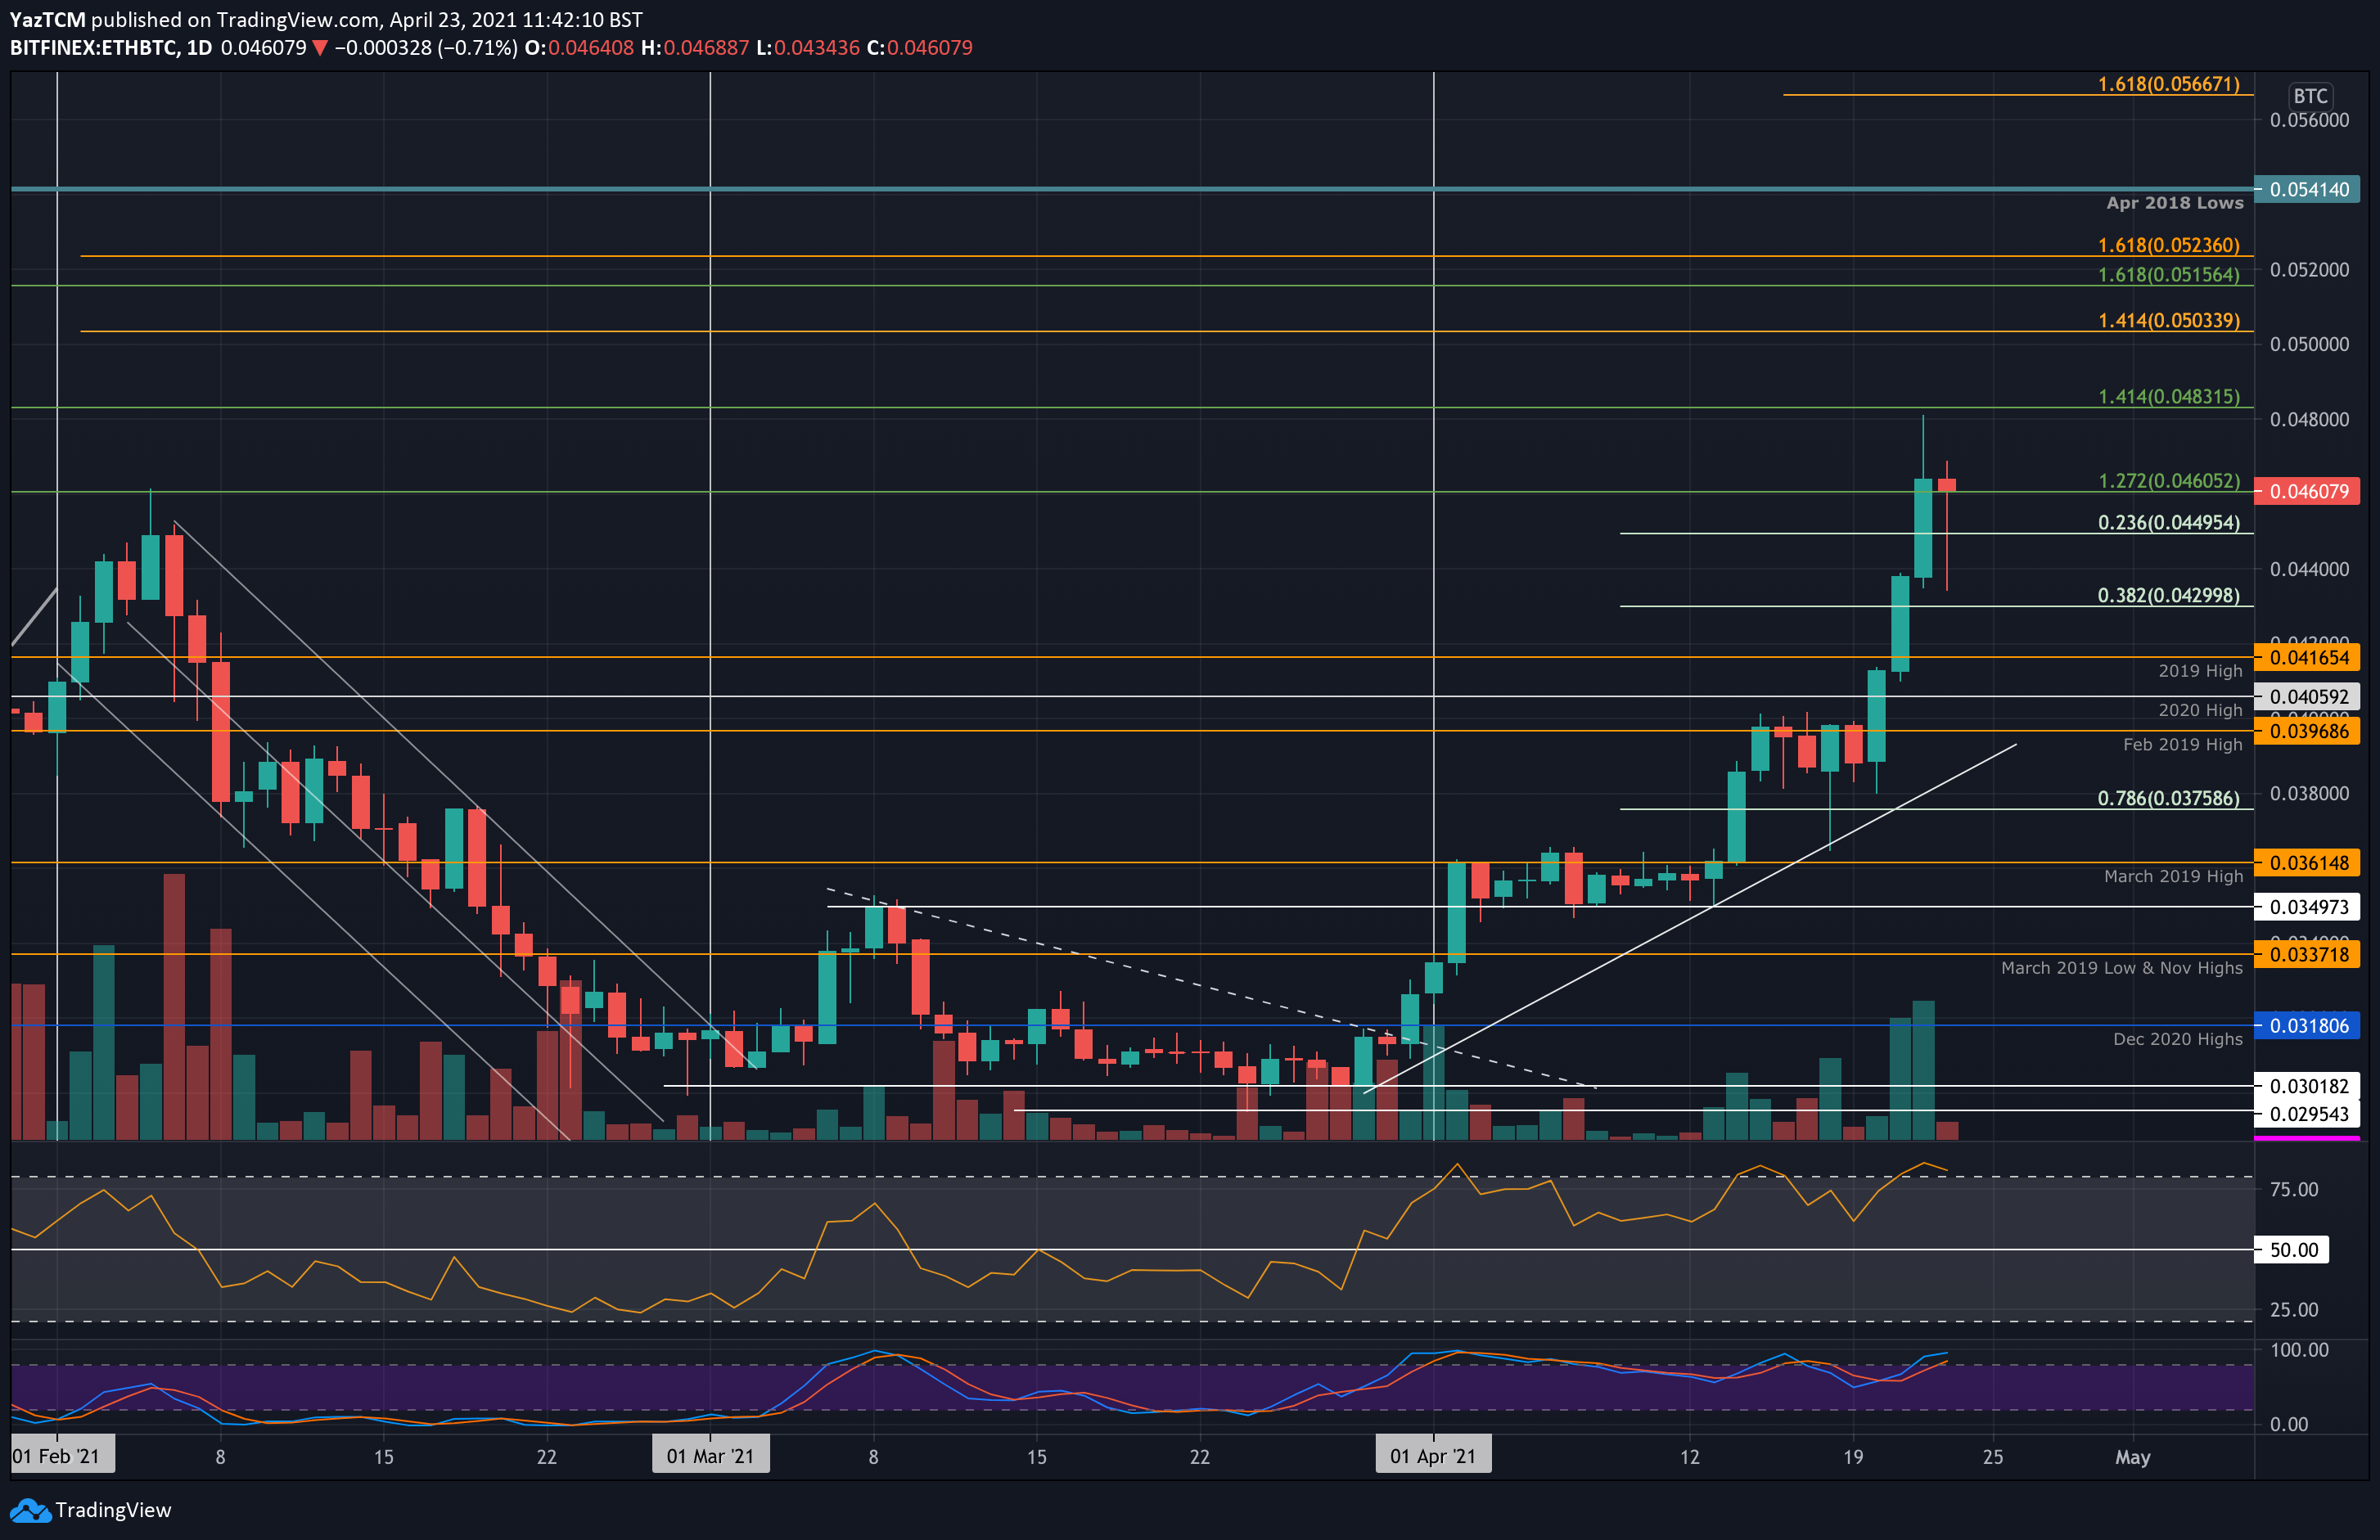
ETH has been outperforming BTC this week. It started the week by breaking the resistance at 0.04 BTC as it went on to penetrate above the 2020 highs (0.0405 BTC) and the 2019 highs (0.0416 BTC).
The market continued further throughout the week as it broke the 2021 high of 0.046 BTC yesterday to reach as high as 0.048 BTC. It has since dropped back to the 0.046 BTC level.
Looking ahead, the first resistance lies at 0.048 BTC. This is followed by 0.05 BTC, 0.0516 BTC, 0.0523 BTC, and 0.0541 BTC (April 2018 Lows).
On the other side, the first support beneath 0.046 BTC lies at 0.045 BTC (.236 Fib). This is followed by 0.044 BTC, 0.0423 BTC (.382 Fib), 0.0416 BTC (2019 High), and 0.0405 BTC (2020 High).
Ripple
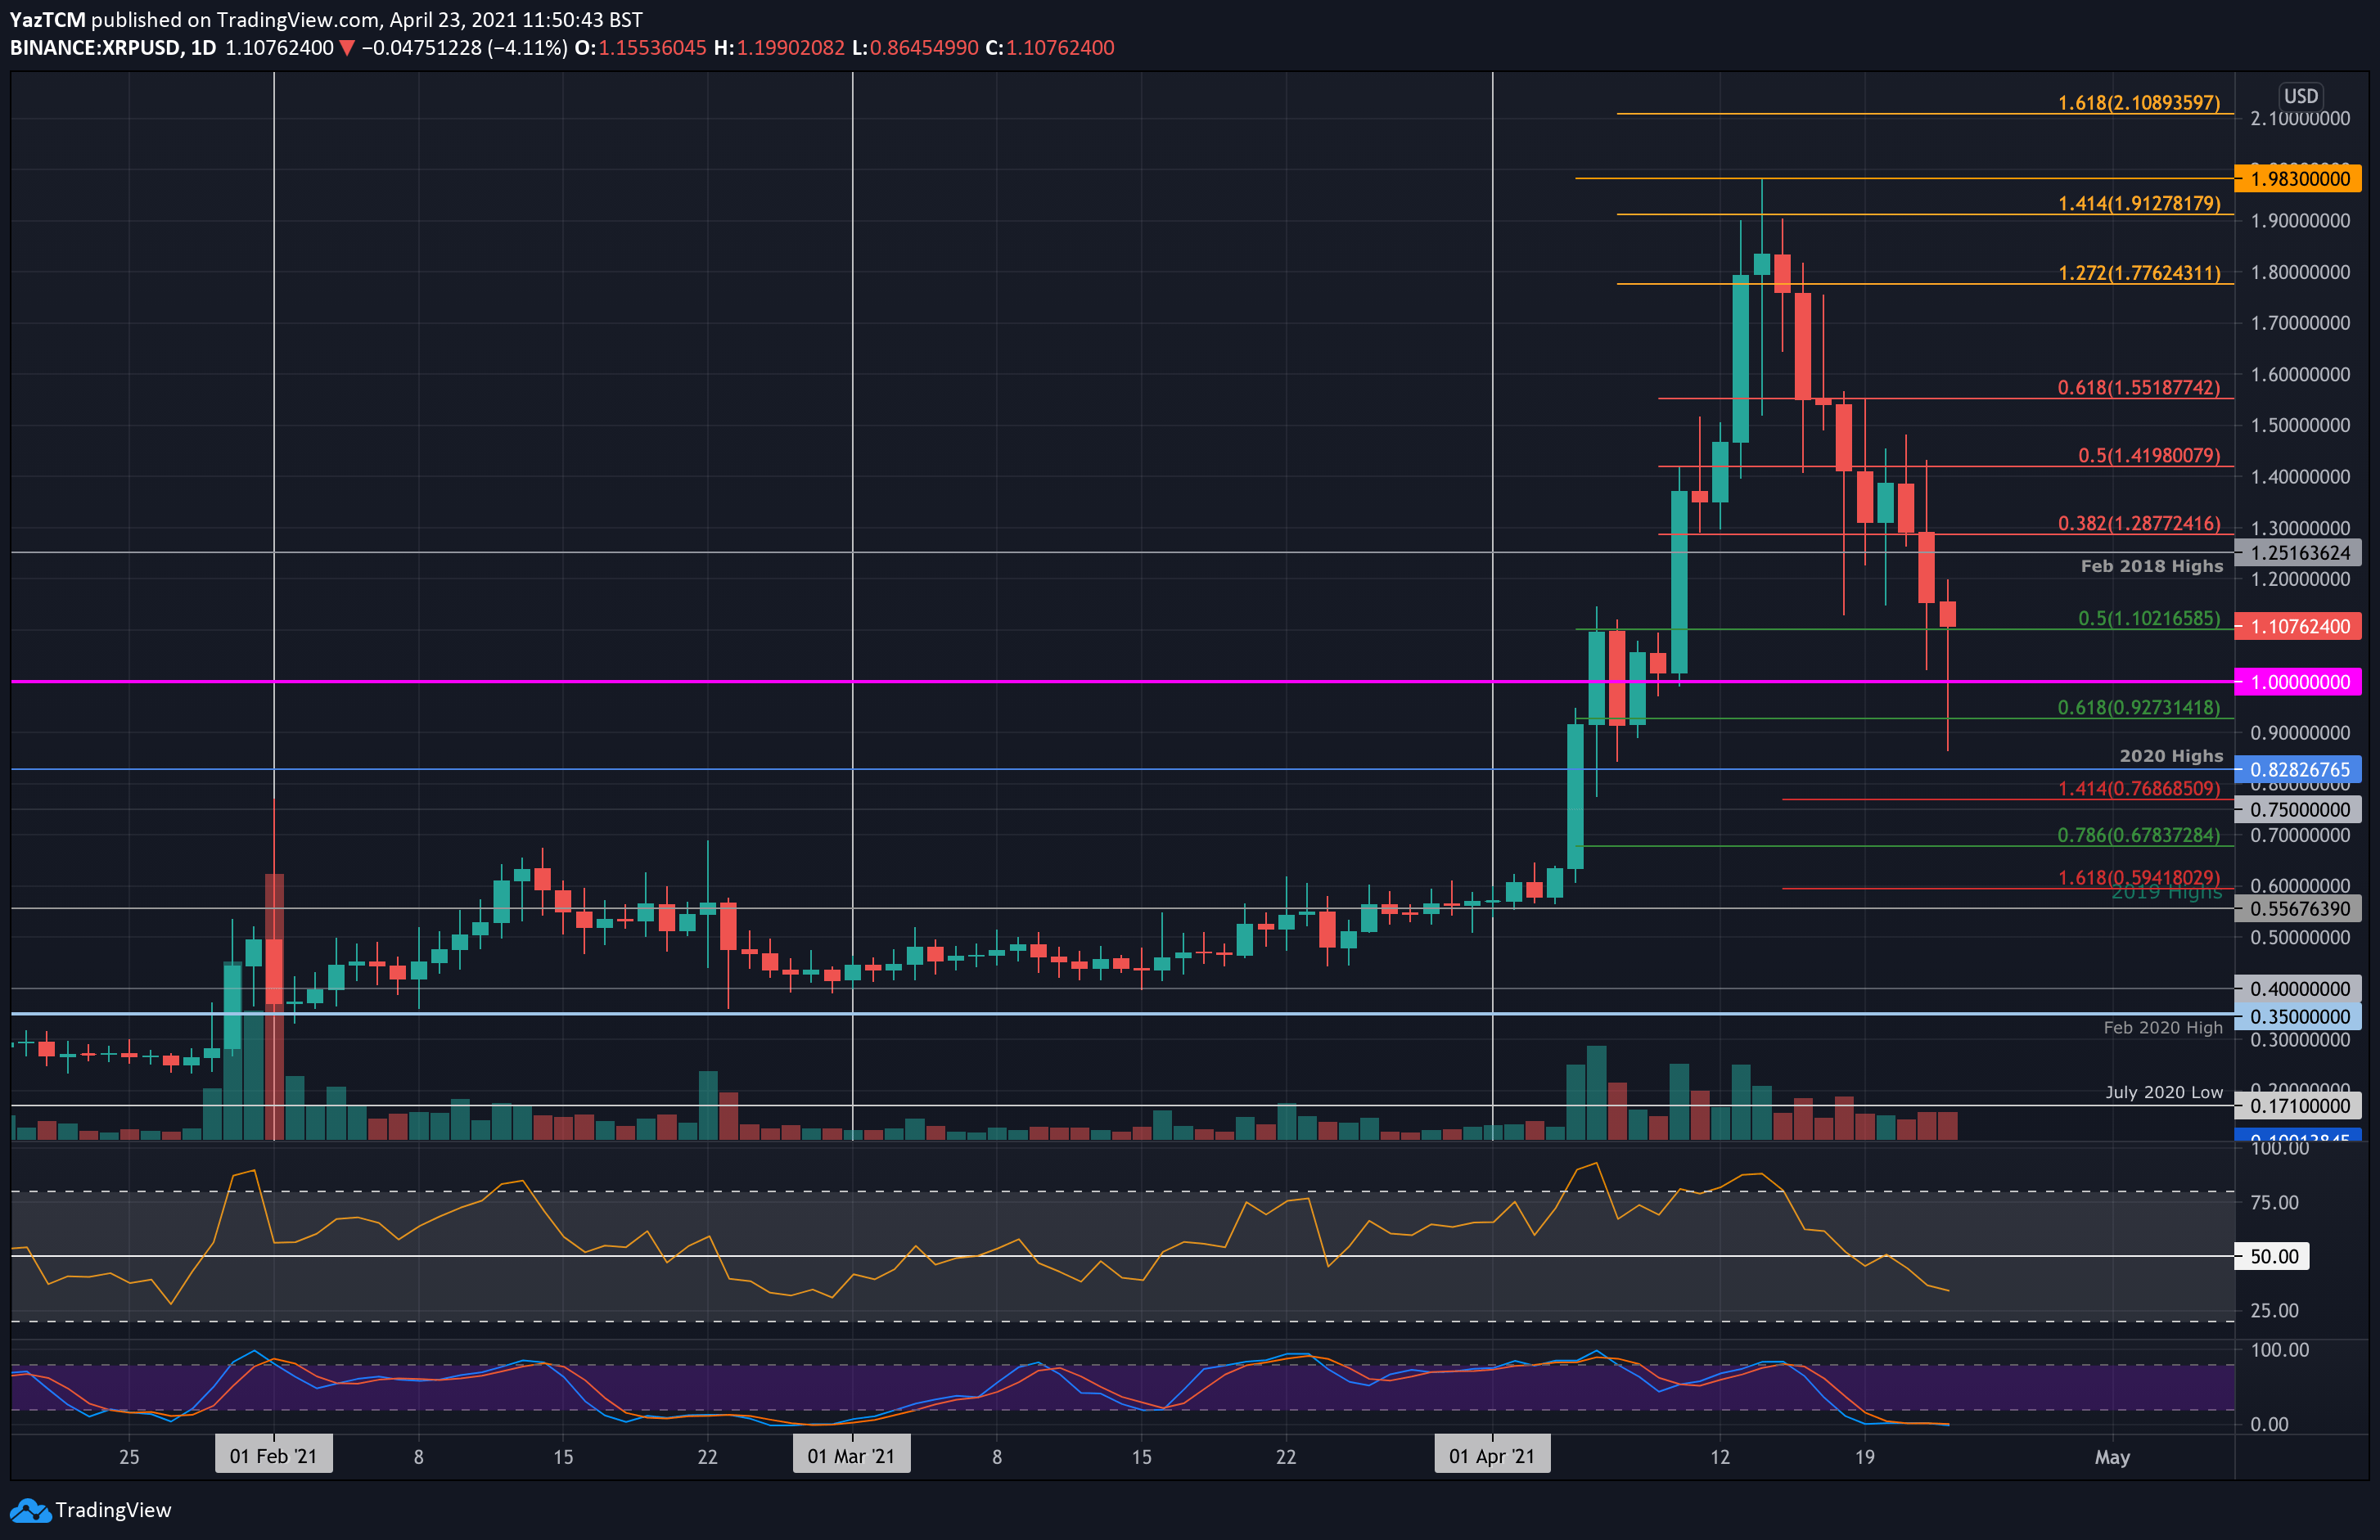
XRP saw a very sharp 37% price decline this week as it falls to the current $1.10 level. The coin set a new multi-year high at $1.98 a couple of weeks ago and has been in a steady decline ever since.
Today, XRP spiked beneath the $1.00 level to reach as low as $0.85. It has since rebounded from there to trade back above $1.00 and sit at the $1.10 (.5 Fib) level.
Looking ahead, the first support beneath $1.10 lies at $1.00. This is followed by $0.927 (.618 Fib), $0.828 (2020 Highs), $0.75, and $0.678 (.786 Fib).
On the other side, the first resistance lies at $1.20. This is followed by $1.25 (Feb 2018 highs), $1.28 (bearish .382 Fib), and $1.42 (bearish .5 Fib).
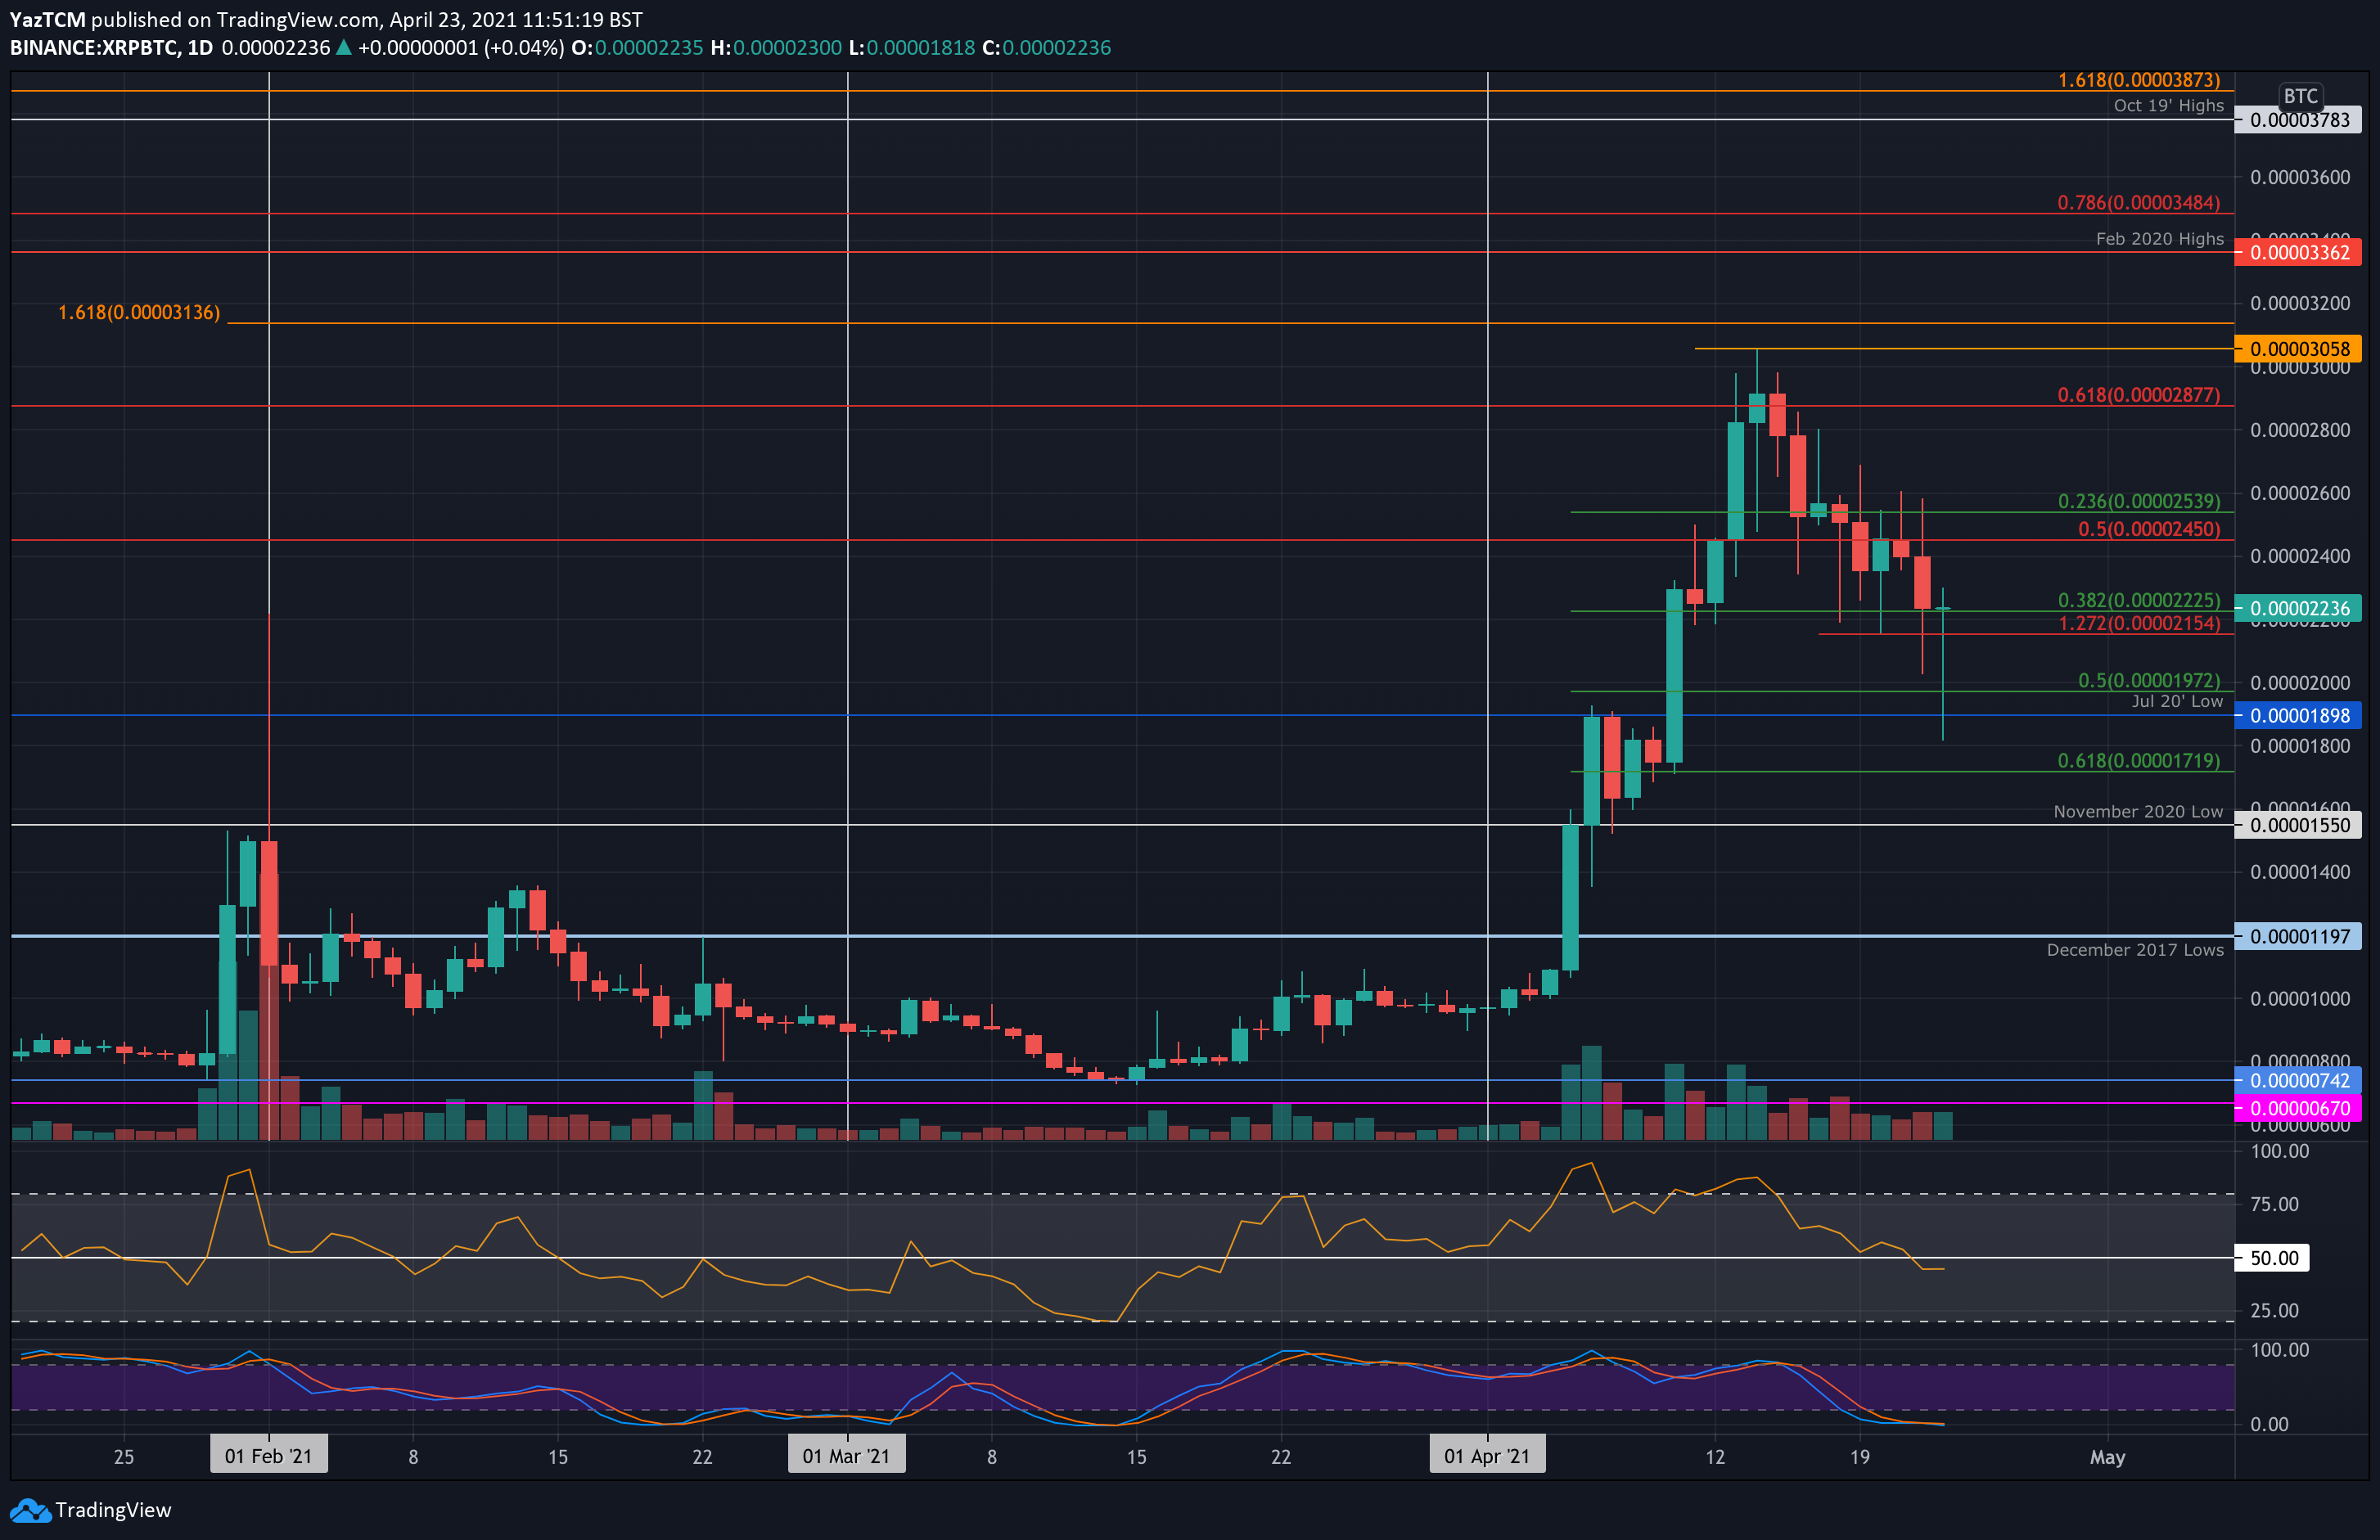
Against bitcoin, XRP has also been in a steady decline since setting a new 2021 high at 3058 SAT a couple of weeks ago. Although it spiked as low as 1800 SAT today, the coin quickly recovered back above 2000 SAT and is battling to remain above the support at 2225 SAT (.382 Fib).
Looking ahead, the first support beneath 2225 SAT lies at 2155 SAT (downside 1.272 Fib Extension). This is followed by 2000 SAT (.5 Fib), 1900 SAT (July 20 lows), 1720 SAT (.618 Fib), and 1550 SAT (Nov 2020 lows).
On the other side, the first resistance lies at 2450 SAT (bearish .5 Fib). This is followed by 2600 SAT, 2877 SAT (bearish .618 Fib), and 3059 SAT.
Cardano
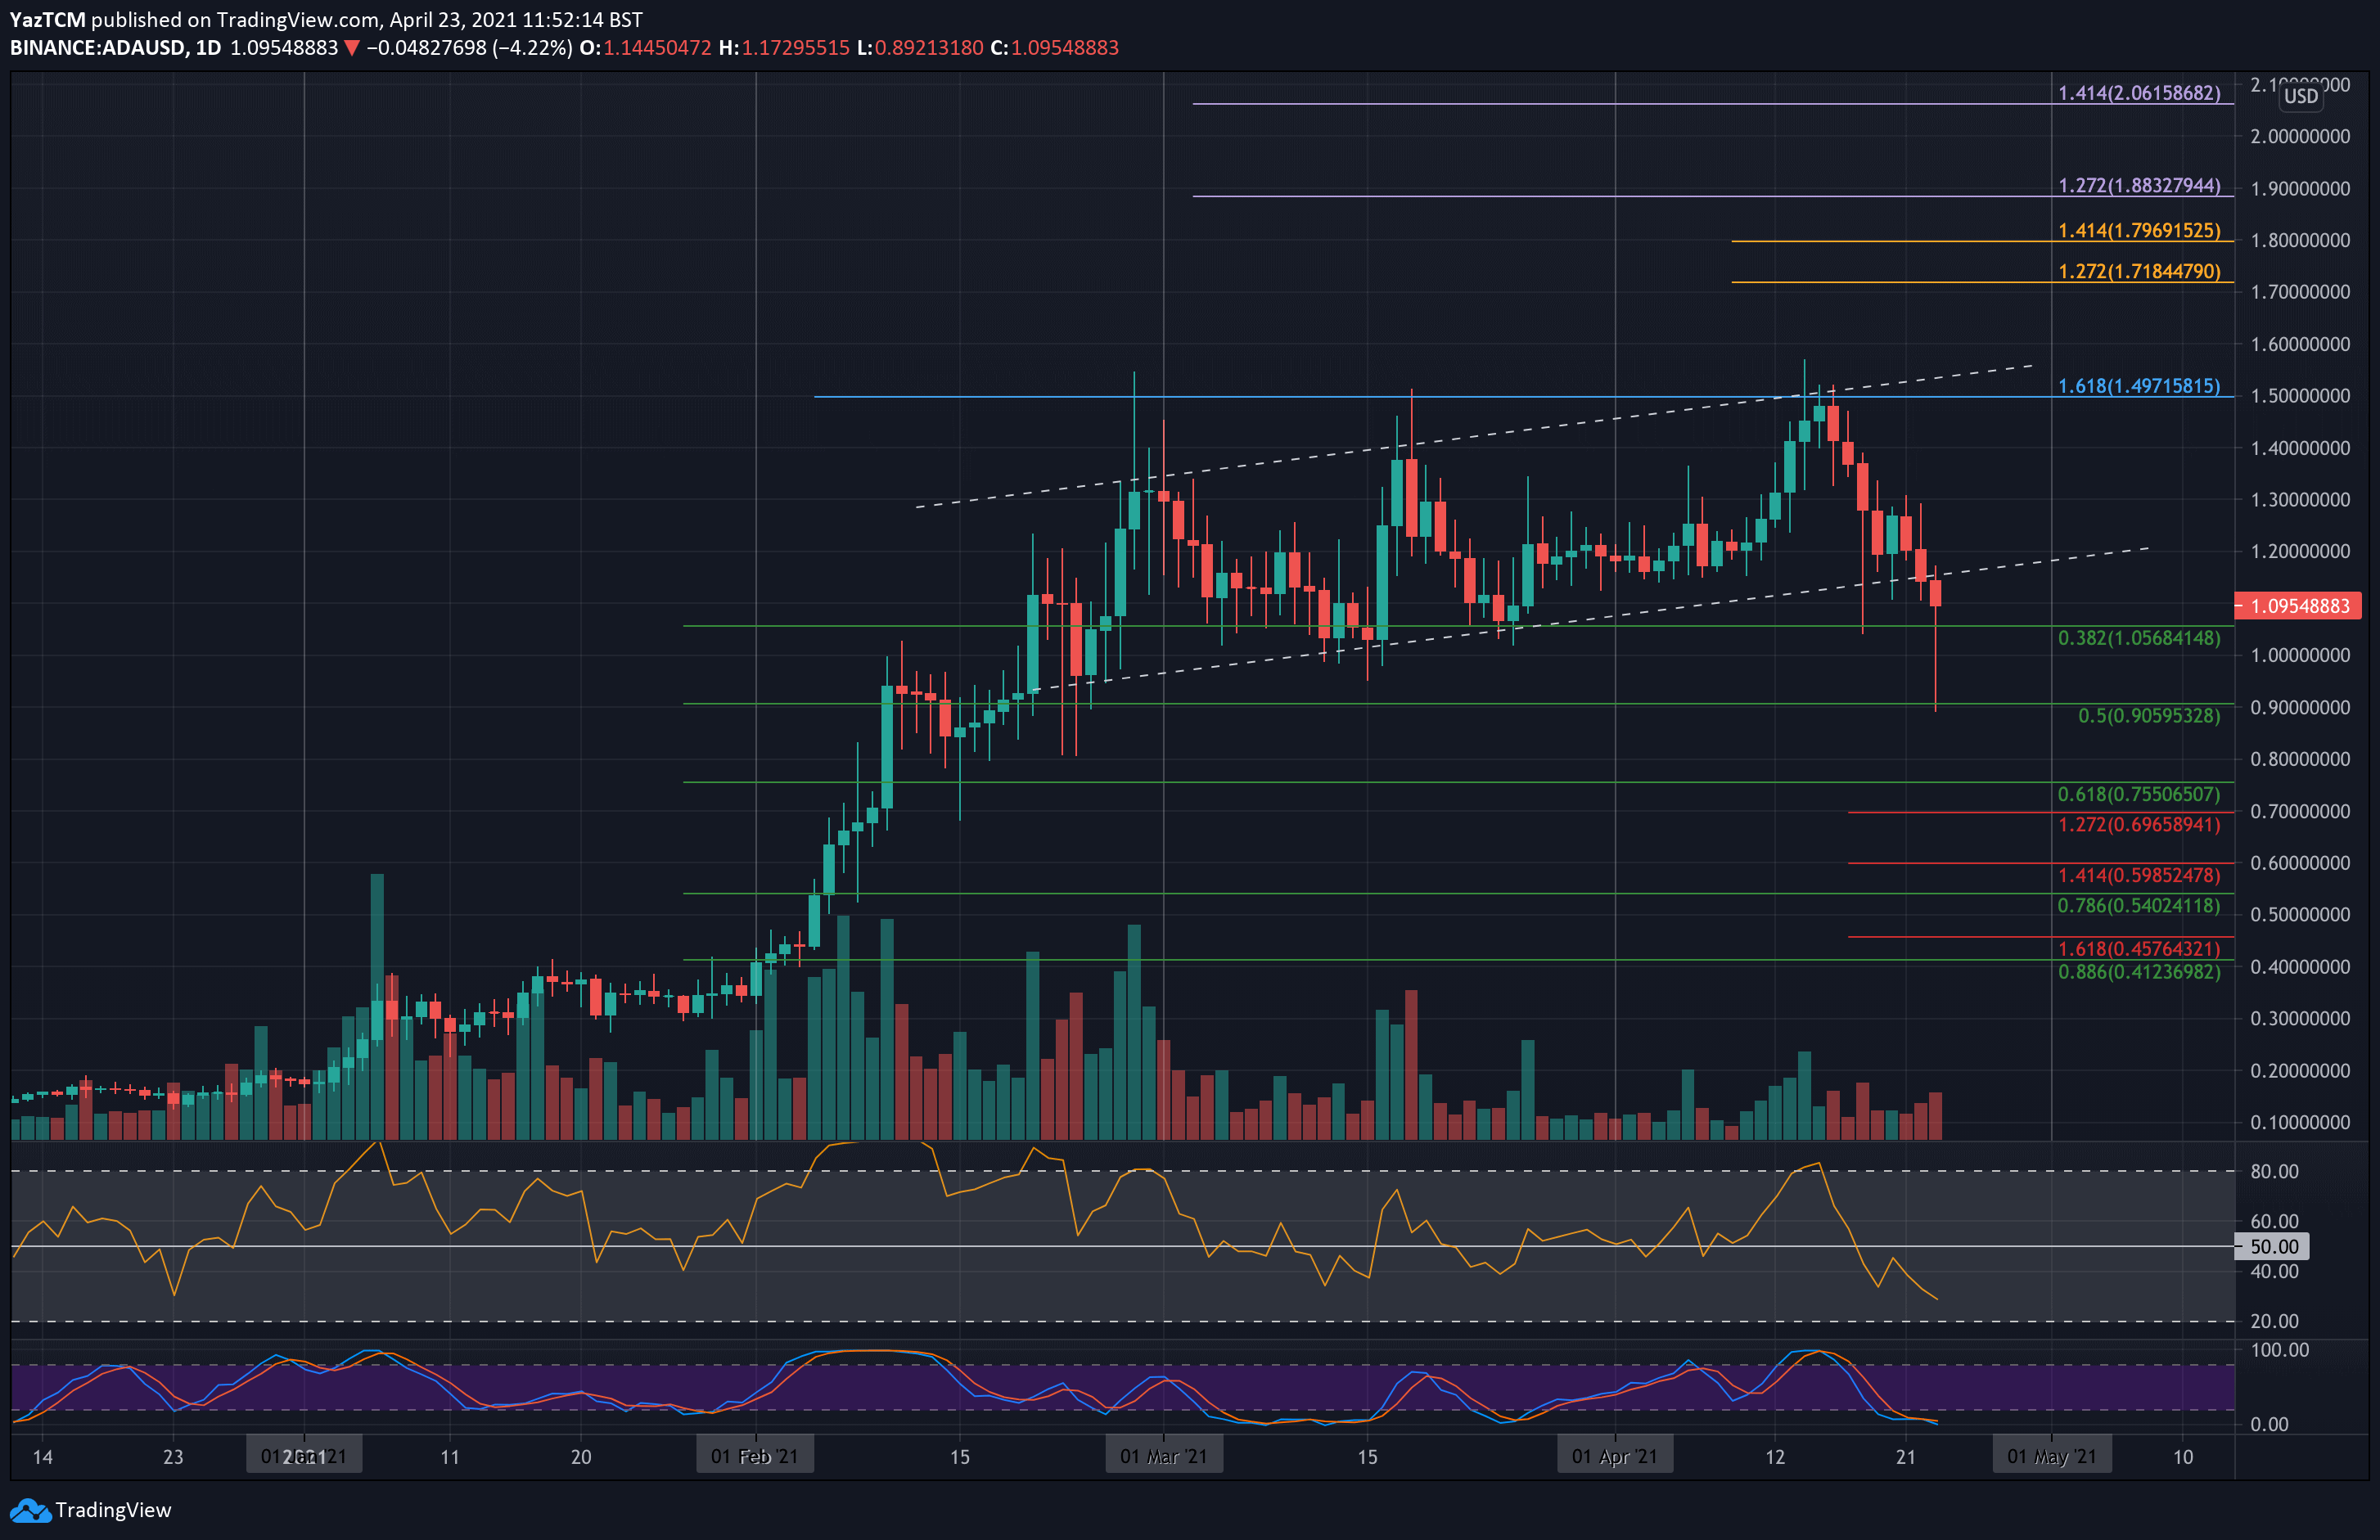
ADA also saw a severe 26% price drop this week as the coin falls to the current $1.10 level. The cryptocurrency failed to break resistance at $1.50 (1.618 Fib Extension) at the start of the week and has been in a steady decline from there.
Today, ADA fell beneath a shallow ascending price channel as it spiked as low as $0.9 (.5 Fib). There, it quickly found support at a .5 Fib and rebounded back above $1.00 to the current $1.10 level.
Looking ahead, the first level of support lies at $1.05 (.382 Fib). This is followed by $1.00, $0.905 (.5 Fib), $0.755 (.618 Fib), and $0.7 (downside 1.272 Fib Extension).
On the other side, the first resistance lies at $1.20. This is followed by $1.40, $1.50, and $1.58 (ATH price).
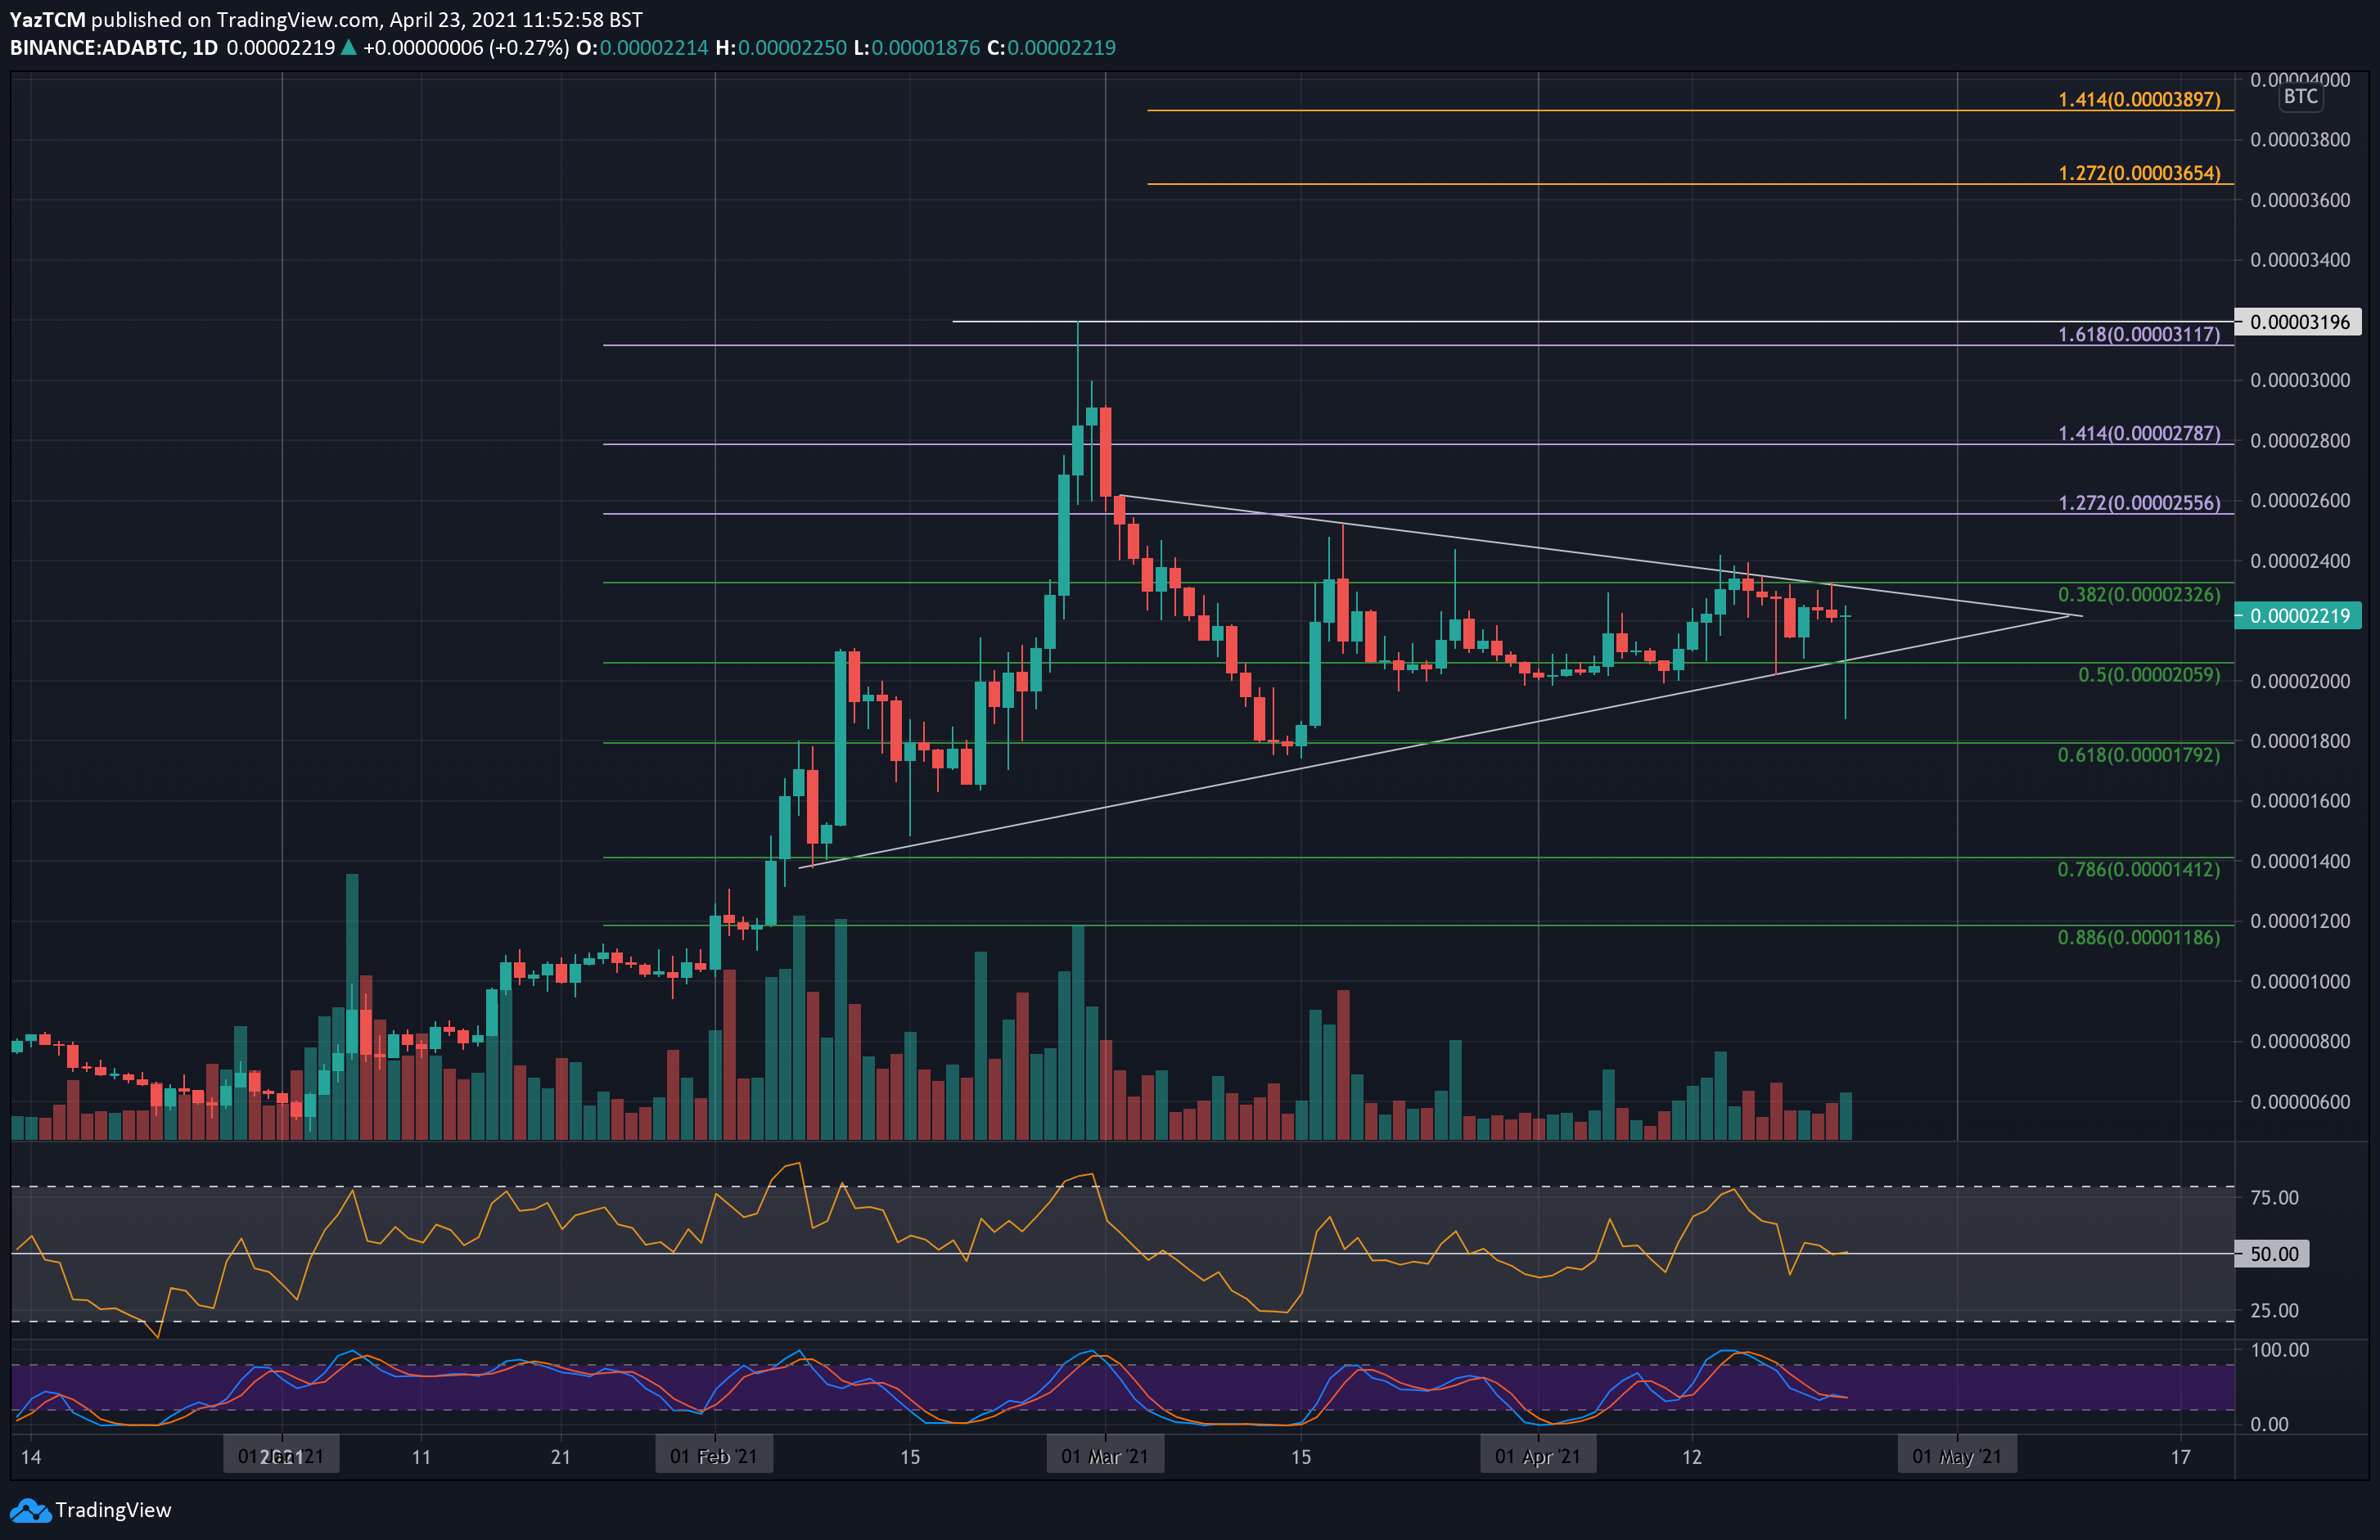
ADA continues to trade inside a symmetrical triangle pattern against BTC. IT has been trapped inside this consolidation period since the beginning of March and has been unable to break either boundary of the triangle in the two following months.
Today, it did spike as low as 1850 SAT but quickly recovered back above 2000 SAT to trade at the current 2200 SAT level. The market will need to break this triangle to dictate the next direction.
Moving forward, the first support lies at 2060 SAT (.5 Fib & Lower boundary of the triangle). This is followed by 2000 SAT, 1792 SAT (.618 Fib), 1600 SAT, and 1412 SAT (.786 Fib).
On the other side, the first resistance lies at 2330 SAT (upper boundary of the triangle). This is followed by 2400 SAT, 2556 SAT, 270 SAT, and 3000 SAT.
Solana
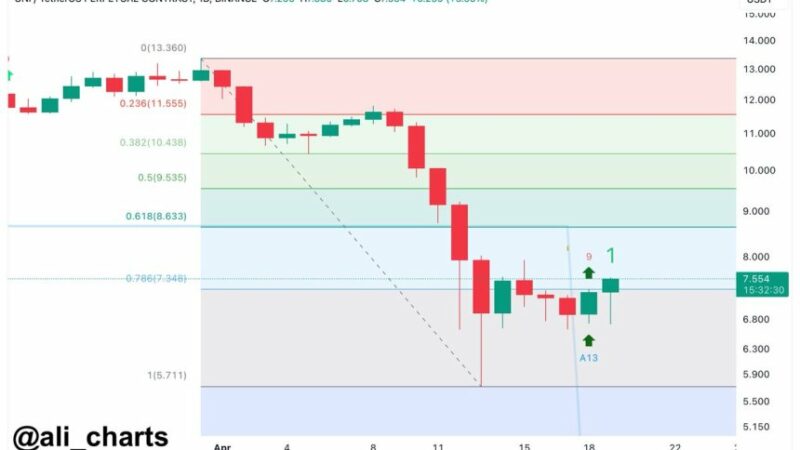
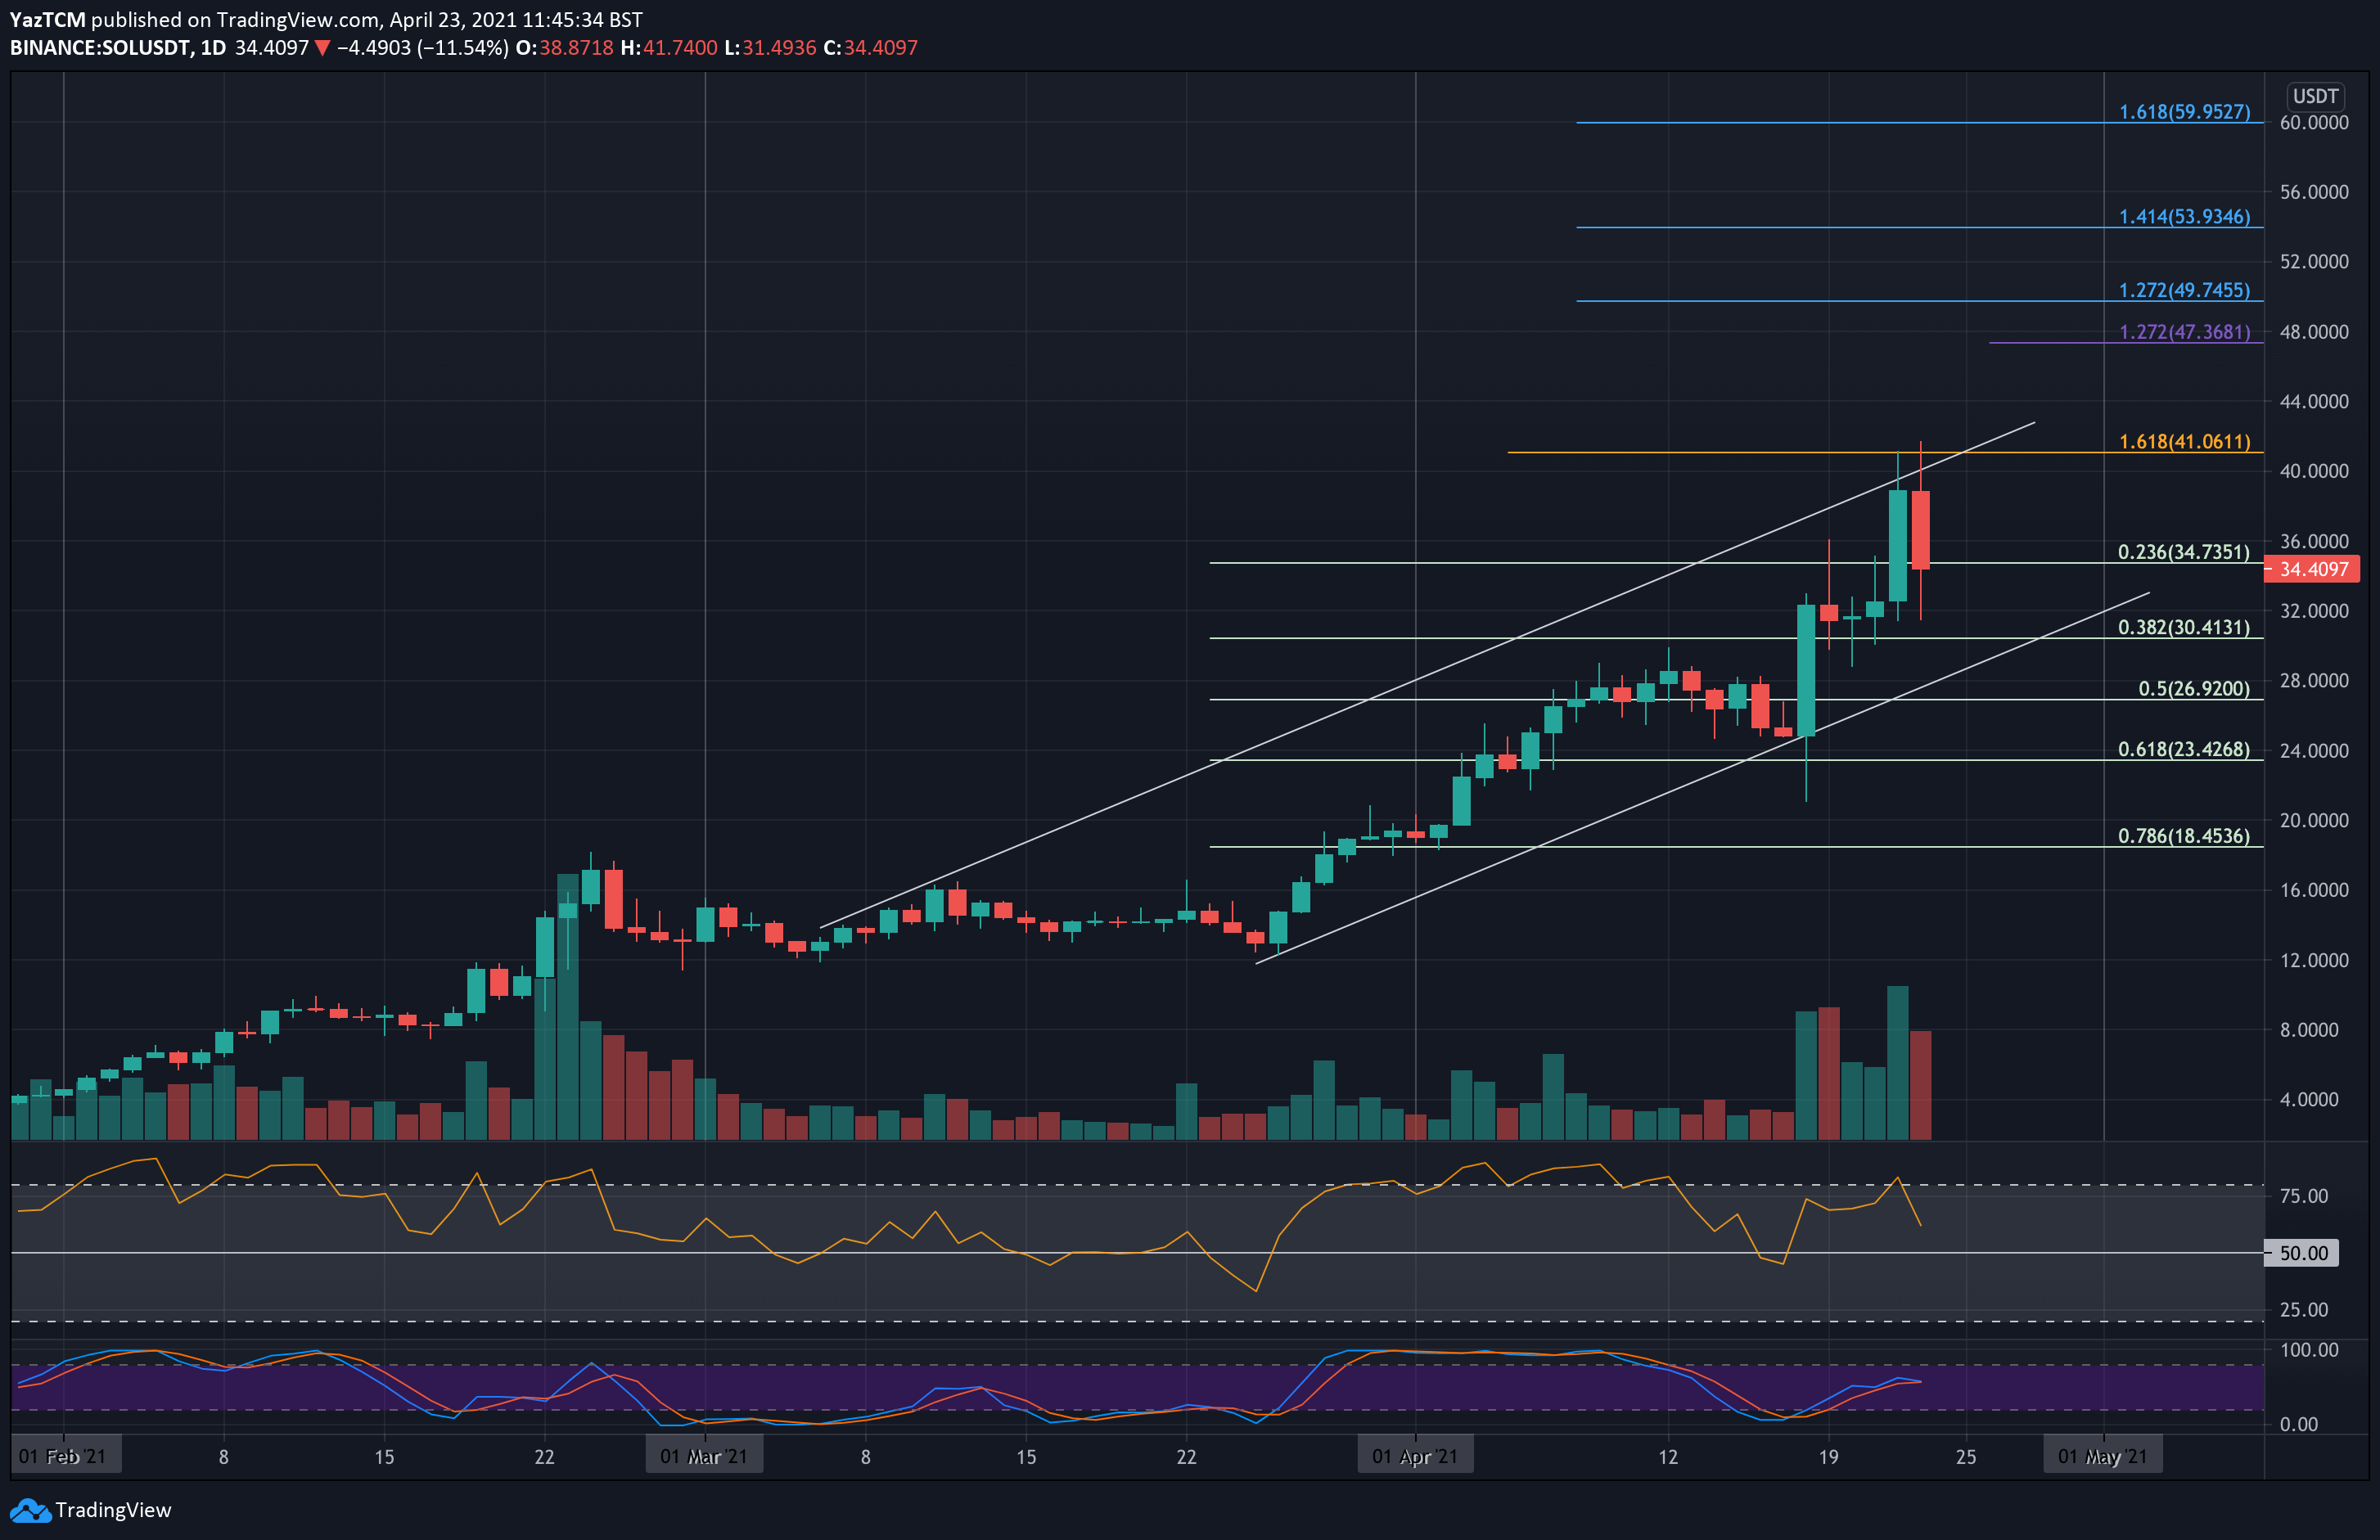
SOL is the only cryptocurrency on this list to see positive price action after climbing by 23.5% over the past week. The cryptocurrency was trading beneath $25 at the beginning of the week as it started to push higher.
Yesterday, SOL managed to set a new ATH price at $41 but quickly reversed from there today to reach the current support at $34.40. The cryptocurrency is trading inside an ascending price channel, and a breakout beneath the price channel would dictate an end to the bullish price run.
Looking ahead, the first support lies at $32. This is followed by $30.41 (.382 Fib), $28 (the lower boundary of the price channel), $26.92 (.5 Fib), and $23.42 (.618 Fib).
On the other side, the first resistance lies at $40. This is followed by $41 (the upper boundary of the price channel and ATH). Beyond the ATH prices, resistance lies at $44, $47.36, $59.75 (1.272 Fib Extension), and $50. Added resistance lies at $53.95, $56, and $60.
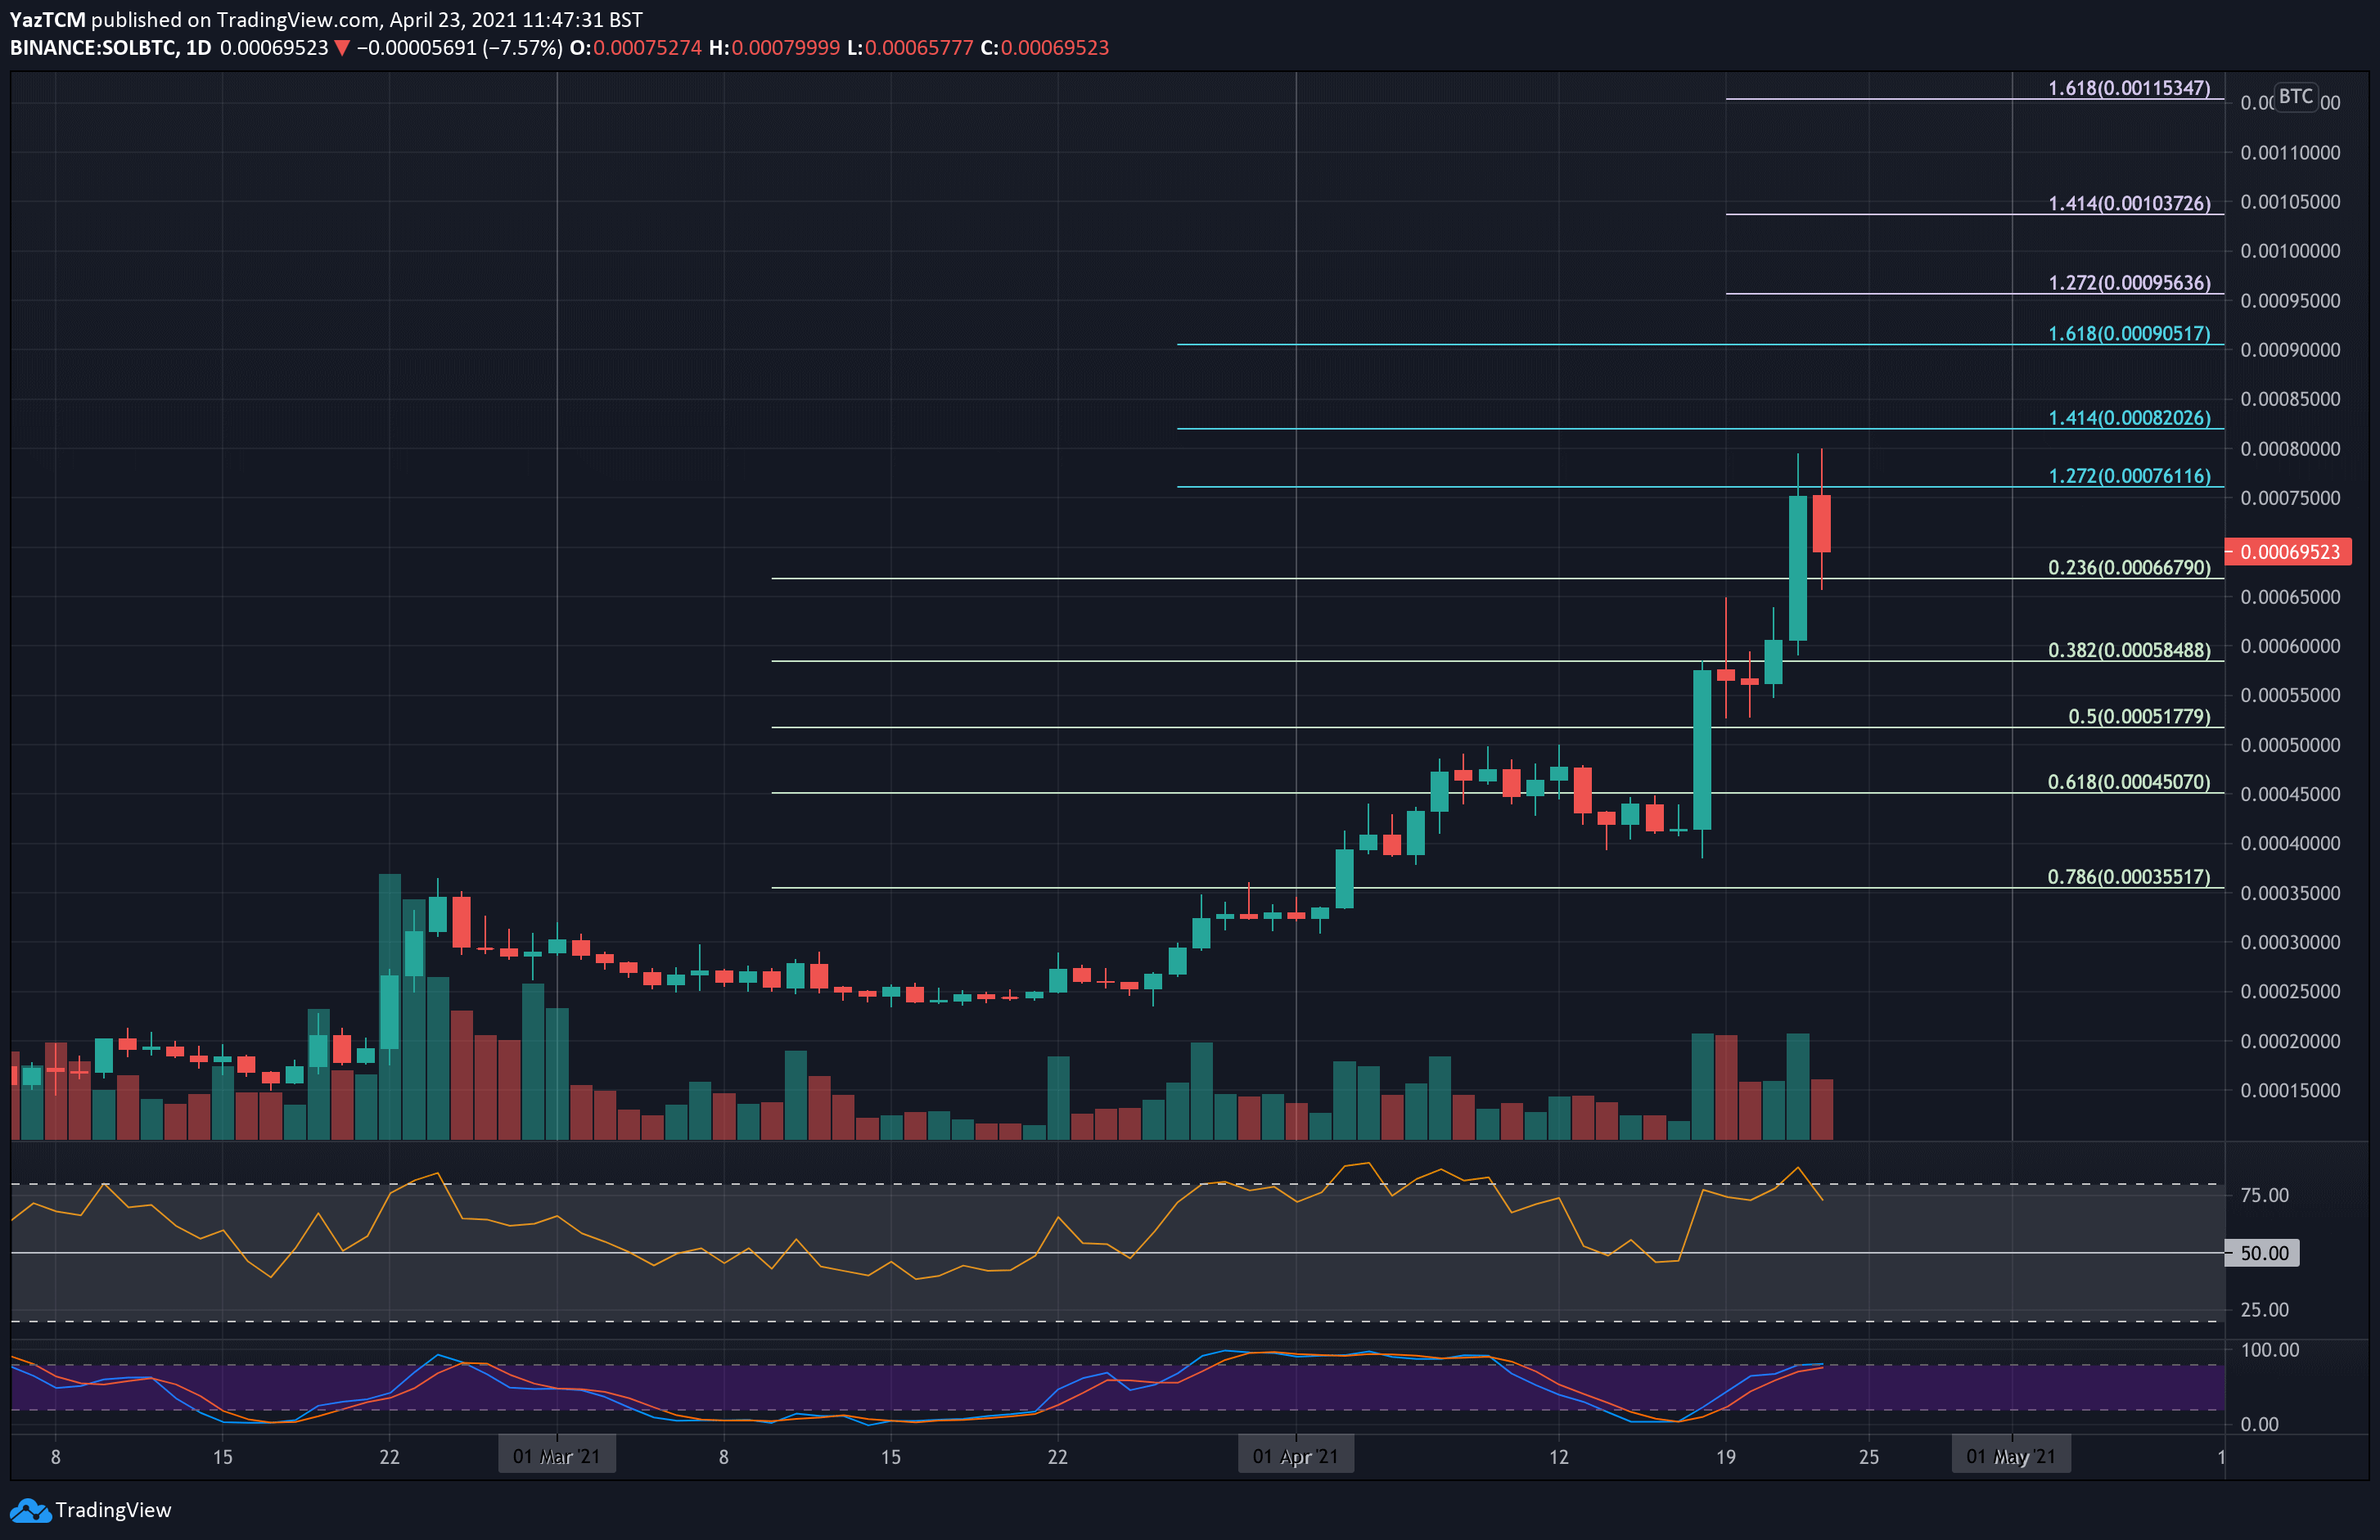
SOL Is also performing very well against bitcoin. It was trading around 0.0004 BTC at the start of the week as it started to push higher. Yesterday, it managed to set a new ATH price at 0.0008 BTC. More specifically, SOL could not close a daily candle above the resistance at 0.000761 BTC(1.272 Fib Extension) and dropped lower from there to the current 0.000695 BTC level.
Moving forward, the first support lies at 0.000667 BTC (.236 Fib). This is followed by 0.000585 BTC (.382 Fib), 0.0005 BTC, 0.000517 BTC (.5 Fib), and 0.00045 BTC (.618 Fib).
On the other side, the first resistance lies at 0.000761 BTC (1.272 Fib Extension). This is followed by 0.0008 BTC, 0.00082 BTC (1.414 Fib Extension), 0.00085 BTC, and 0.0009 BTC (1.618 Fib Extension).
Binance Futures 50 USDT FREE Voucher: Use this link to register & get 10% off fees and 50 USDT when trading 500 USDT (limited offer).
PrimeXBT Special Offer: Use this link to register & enter POTATO50 code to get 50% free bonus on any deposit up to 1 BTC.
Disclaimer: Information found on CryptoPotato is those of writers quoted. It does not represent the opinions of CryptoPotato on whether to buy, sell, or hold any investments. You are advised to conduct your own research before making any investment decisions. Use provided information at your own risk. See Disclaimer for more information.
Cryptocurrency charts by TradingView.