Cardano Price Analysis: ADA Bulls Rely on Important Support but Will The Recovery Continue?
ADA/USD – ADA Battling To Stay Above 20-day MA
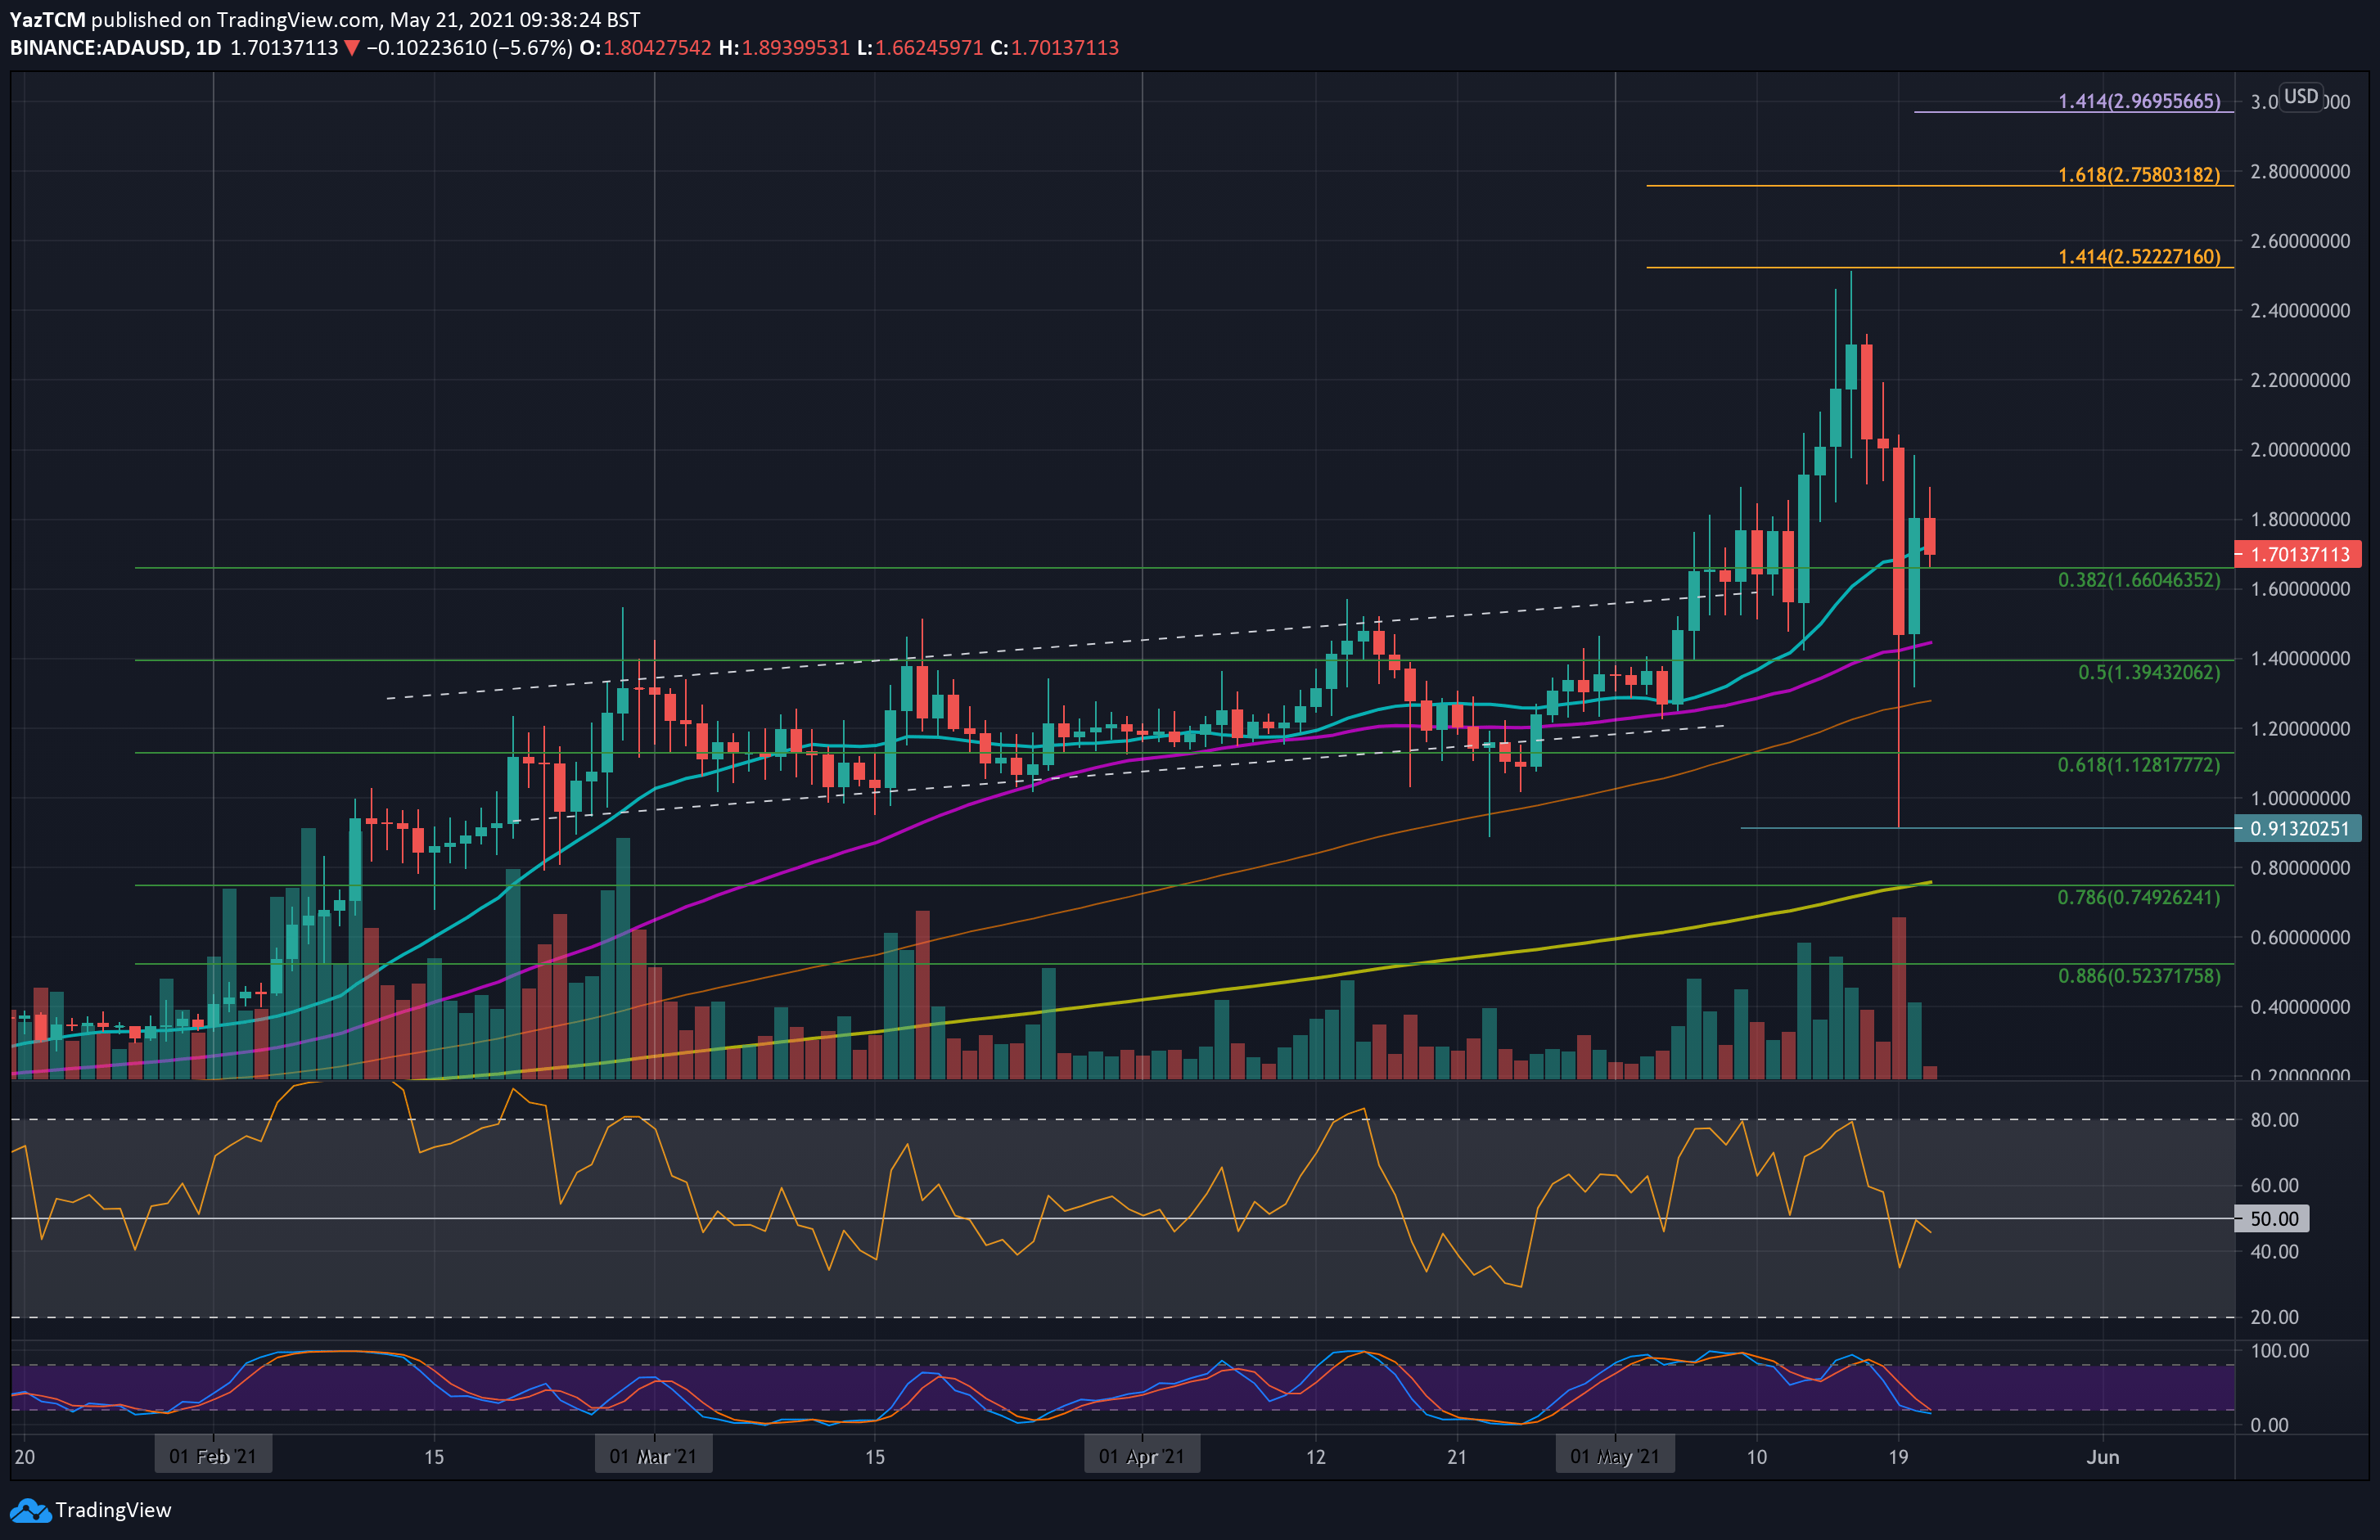
Key Support Levels: $1.66, $1.45, $1.40.
Key Resistance Levels: $1.80, $2.00, $2.20.
ADA set a new ATH price last weekend as it surged into resistance at $2.52 (1.414 Fib Extension). Unfortunately, it could not continue past this level and ended up rolling over at the start of the week to hit $2.00 by Tuesday.
On Wednesday, the BTC market crash called every cryptocurrency to capitulate. During this time, ADA slipped beneath the 50-day and 100-day MA levels and continued below $1.00 until finding support at $0.913.
Luckily, it quickly rebounded from there and managed to close the daily candle above the 50-day MA at around $1.45. Yesterday, ADA started the recovery process but was unable to close the daily candle above $1.80. It has since dropped to $1.70 today.

ADA-USD Short Term Price Prediction
Looking ahead, the first support lies at $1.66 (.382 Fib). This is followed by $1.45 (50-day MA), $1.40 (.5 Fib), $1.30 (100-day MA), and $1.12 (.618 Fib).
On the other side, the first resistance lies at $1.80. This is followed by $2.00, $2.20, $2.40, and $2.52 (ATH).
The RSI is beneath the midline as the bears take control. If it continues to sink further beneath 50, the increased bearish momentum is likely to drive ADA Back toward the 50-day MA.
ADA/BTC – Bulls Rebound From .618 Fib Support
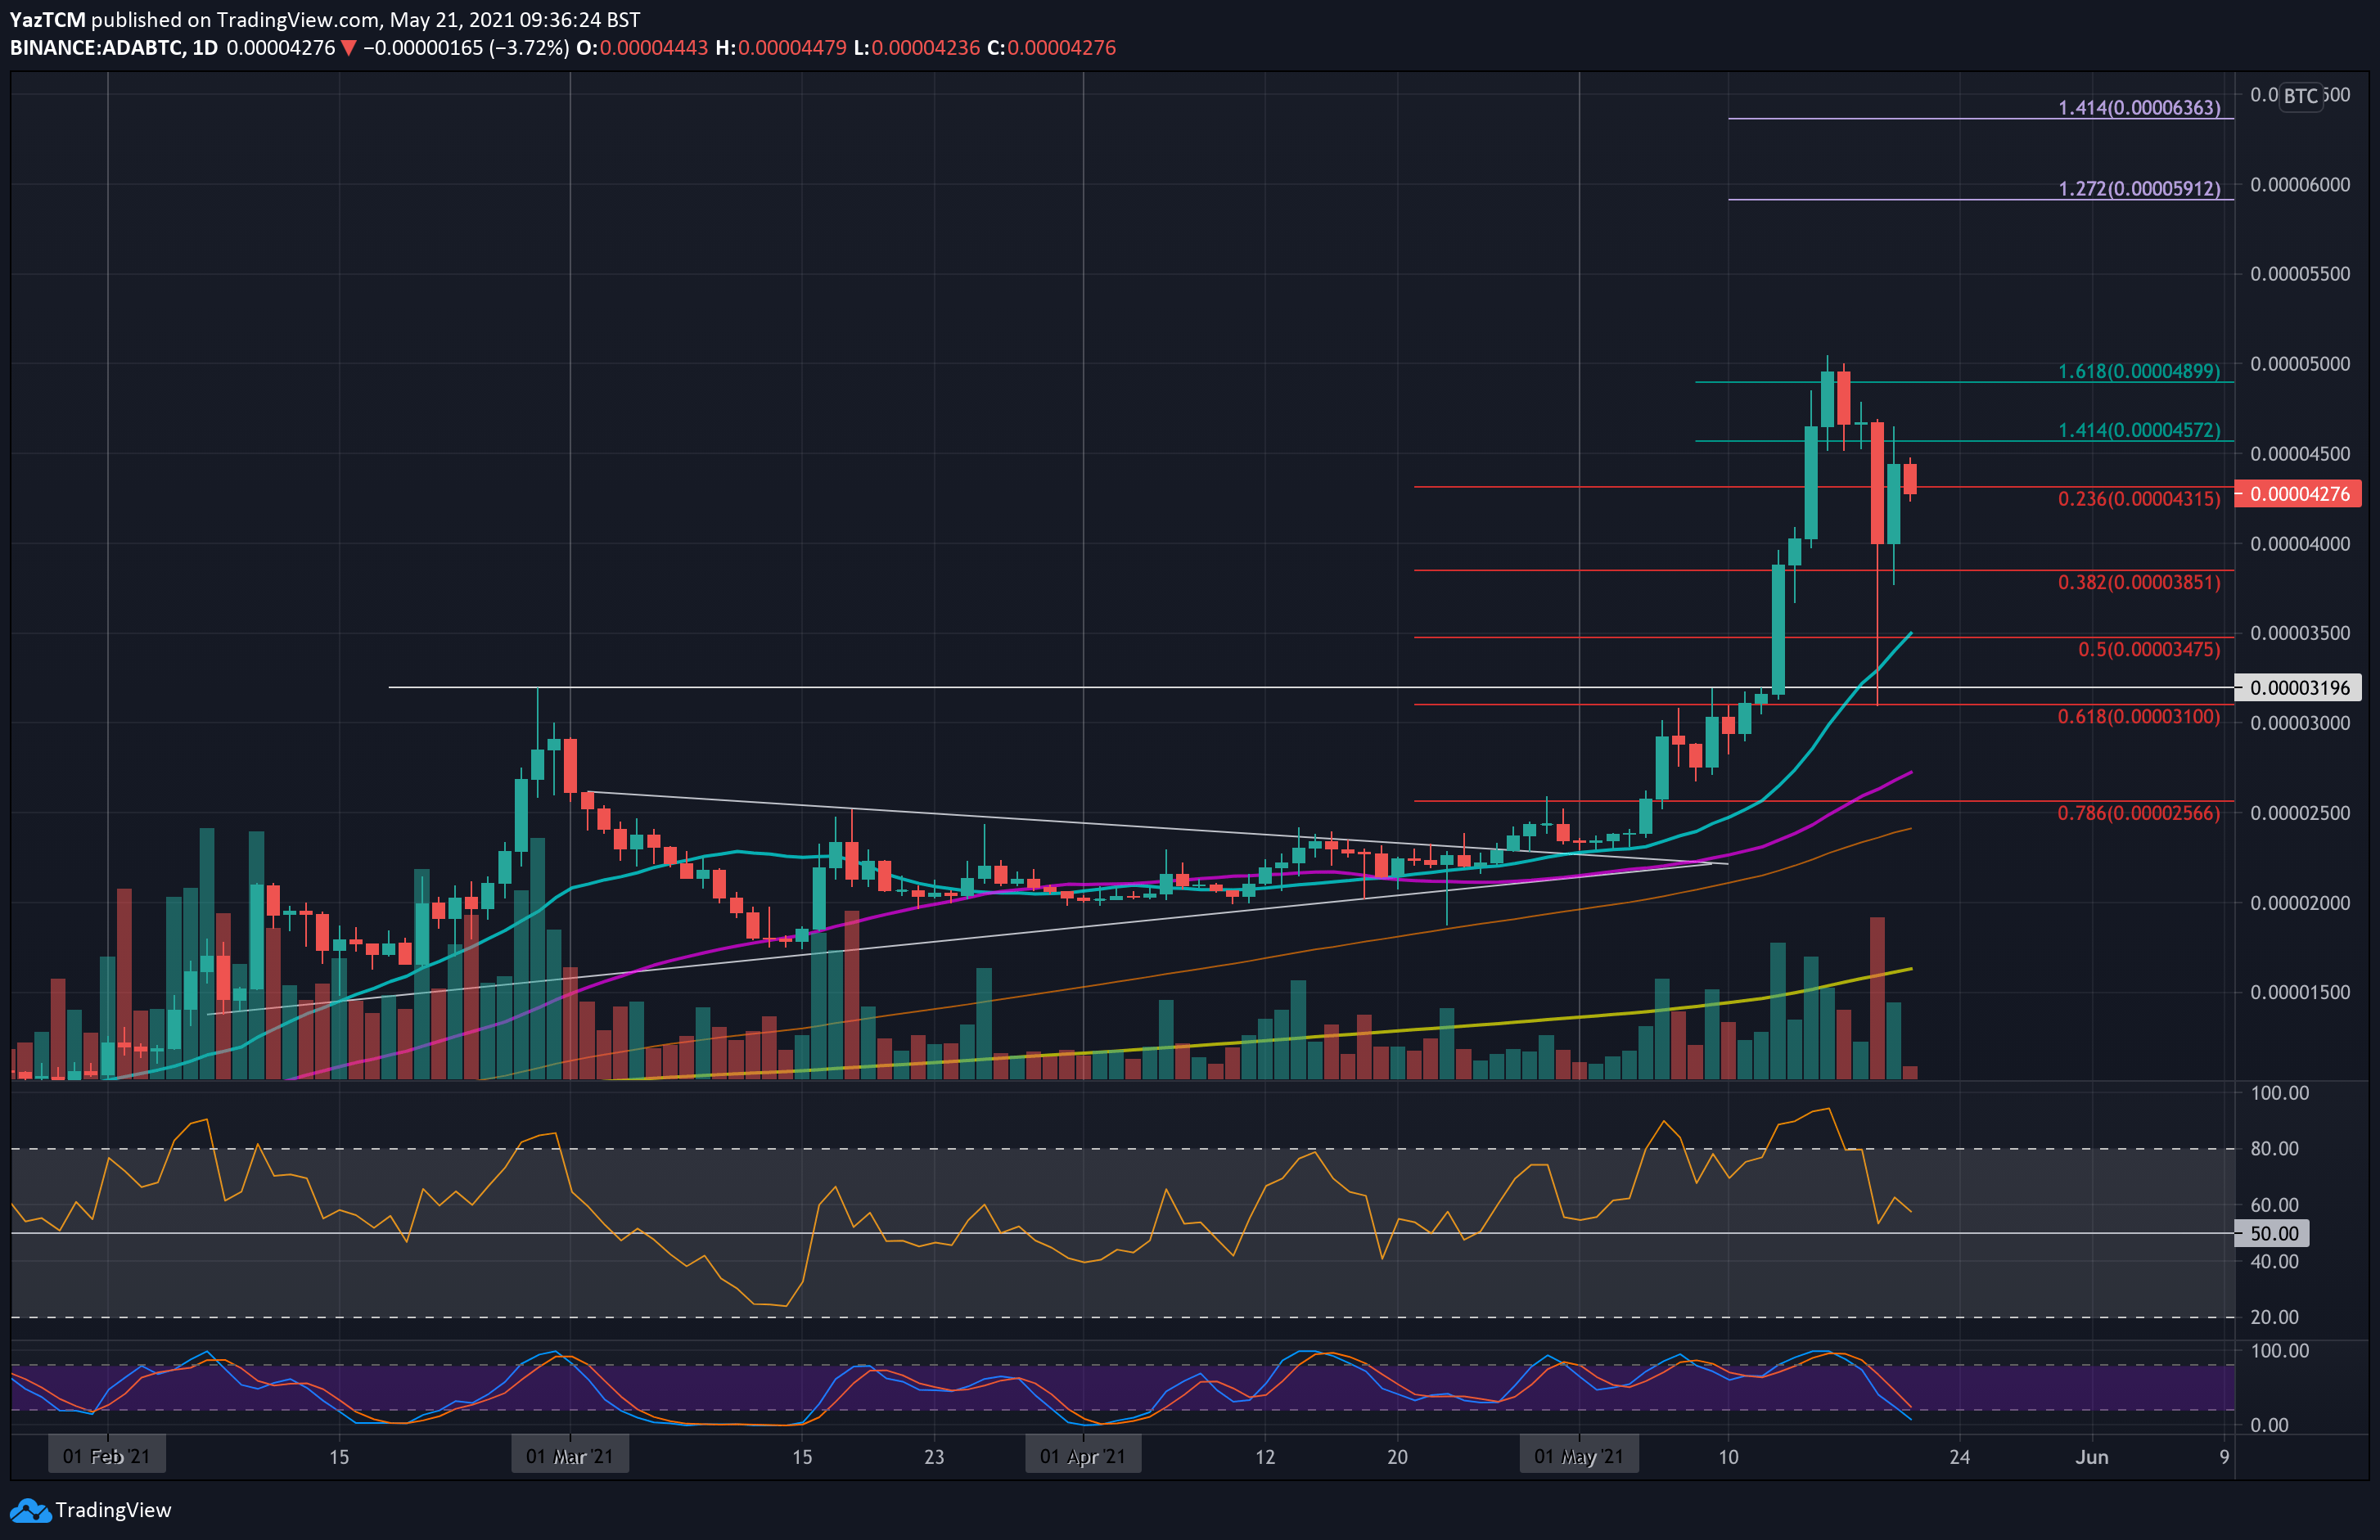
Key Support Levels: 4000 SAT, 3850 SAT, 3475 SAT.
Key Resistance Levels: 4500 SAT, 5000 SAT, 5500 SAT.
ADA also printed a new high above 5000 SAT last week but started to head lower at the start of this week. During the Wednesday price crash, ADA dropped beneath 4500 SAT and continued lower until support was found at 3100 SAT (.618 Fib).
It rebounded from the support at 3100 SAT and managed to close the daily candle on Wednesday at 4000 SAT. Yesterday, ADA started to rebound to reach as high as 4600 SAT. However, it has dropped slightly today as it trades at 4275 SAT.
ADA-BTC Short Term Price Prediction
Moving forward, the first support lies at 4000 SAT. This is followed by 3850 SAT (.382 Fib), 3475 SAT (.5 Fib & 20-day MA), 3100 SAT (.618 Fib), and 3000 SAT.
On the other side, the first resistance lies at 4500 SAT (1.414 Fib Extension). This is followed by 5000 SAT, 5500 SAT, 5912 SAT (1.272 Fib Extension), 6000 SAT, and 6363 SAT (1.414 Fib Extension).
The RSI is still above the midline but is starting to head lower, indicating that the bullish momentum is showing signs of fading.