Ethereum Price Analysis: ETH Eyes $2.6K But Struggles Against Bitcoin

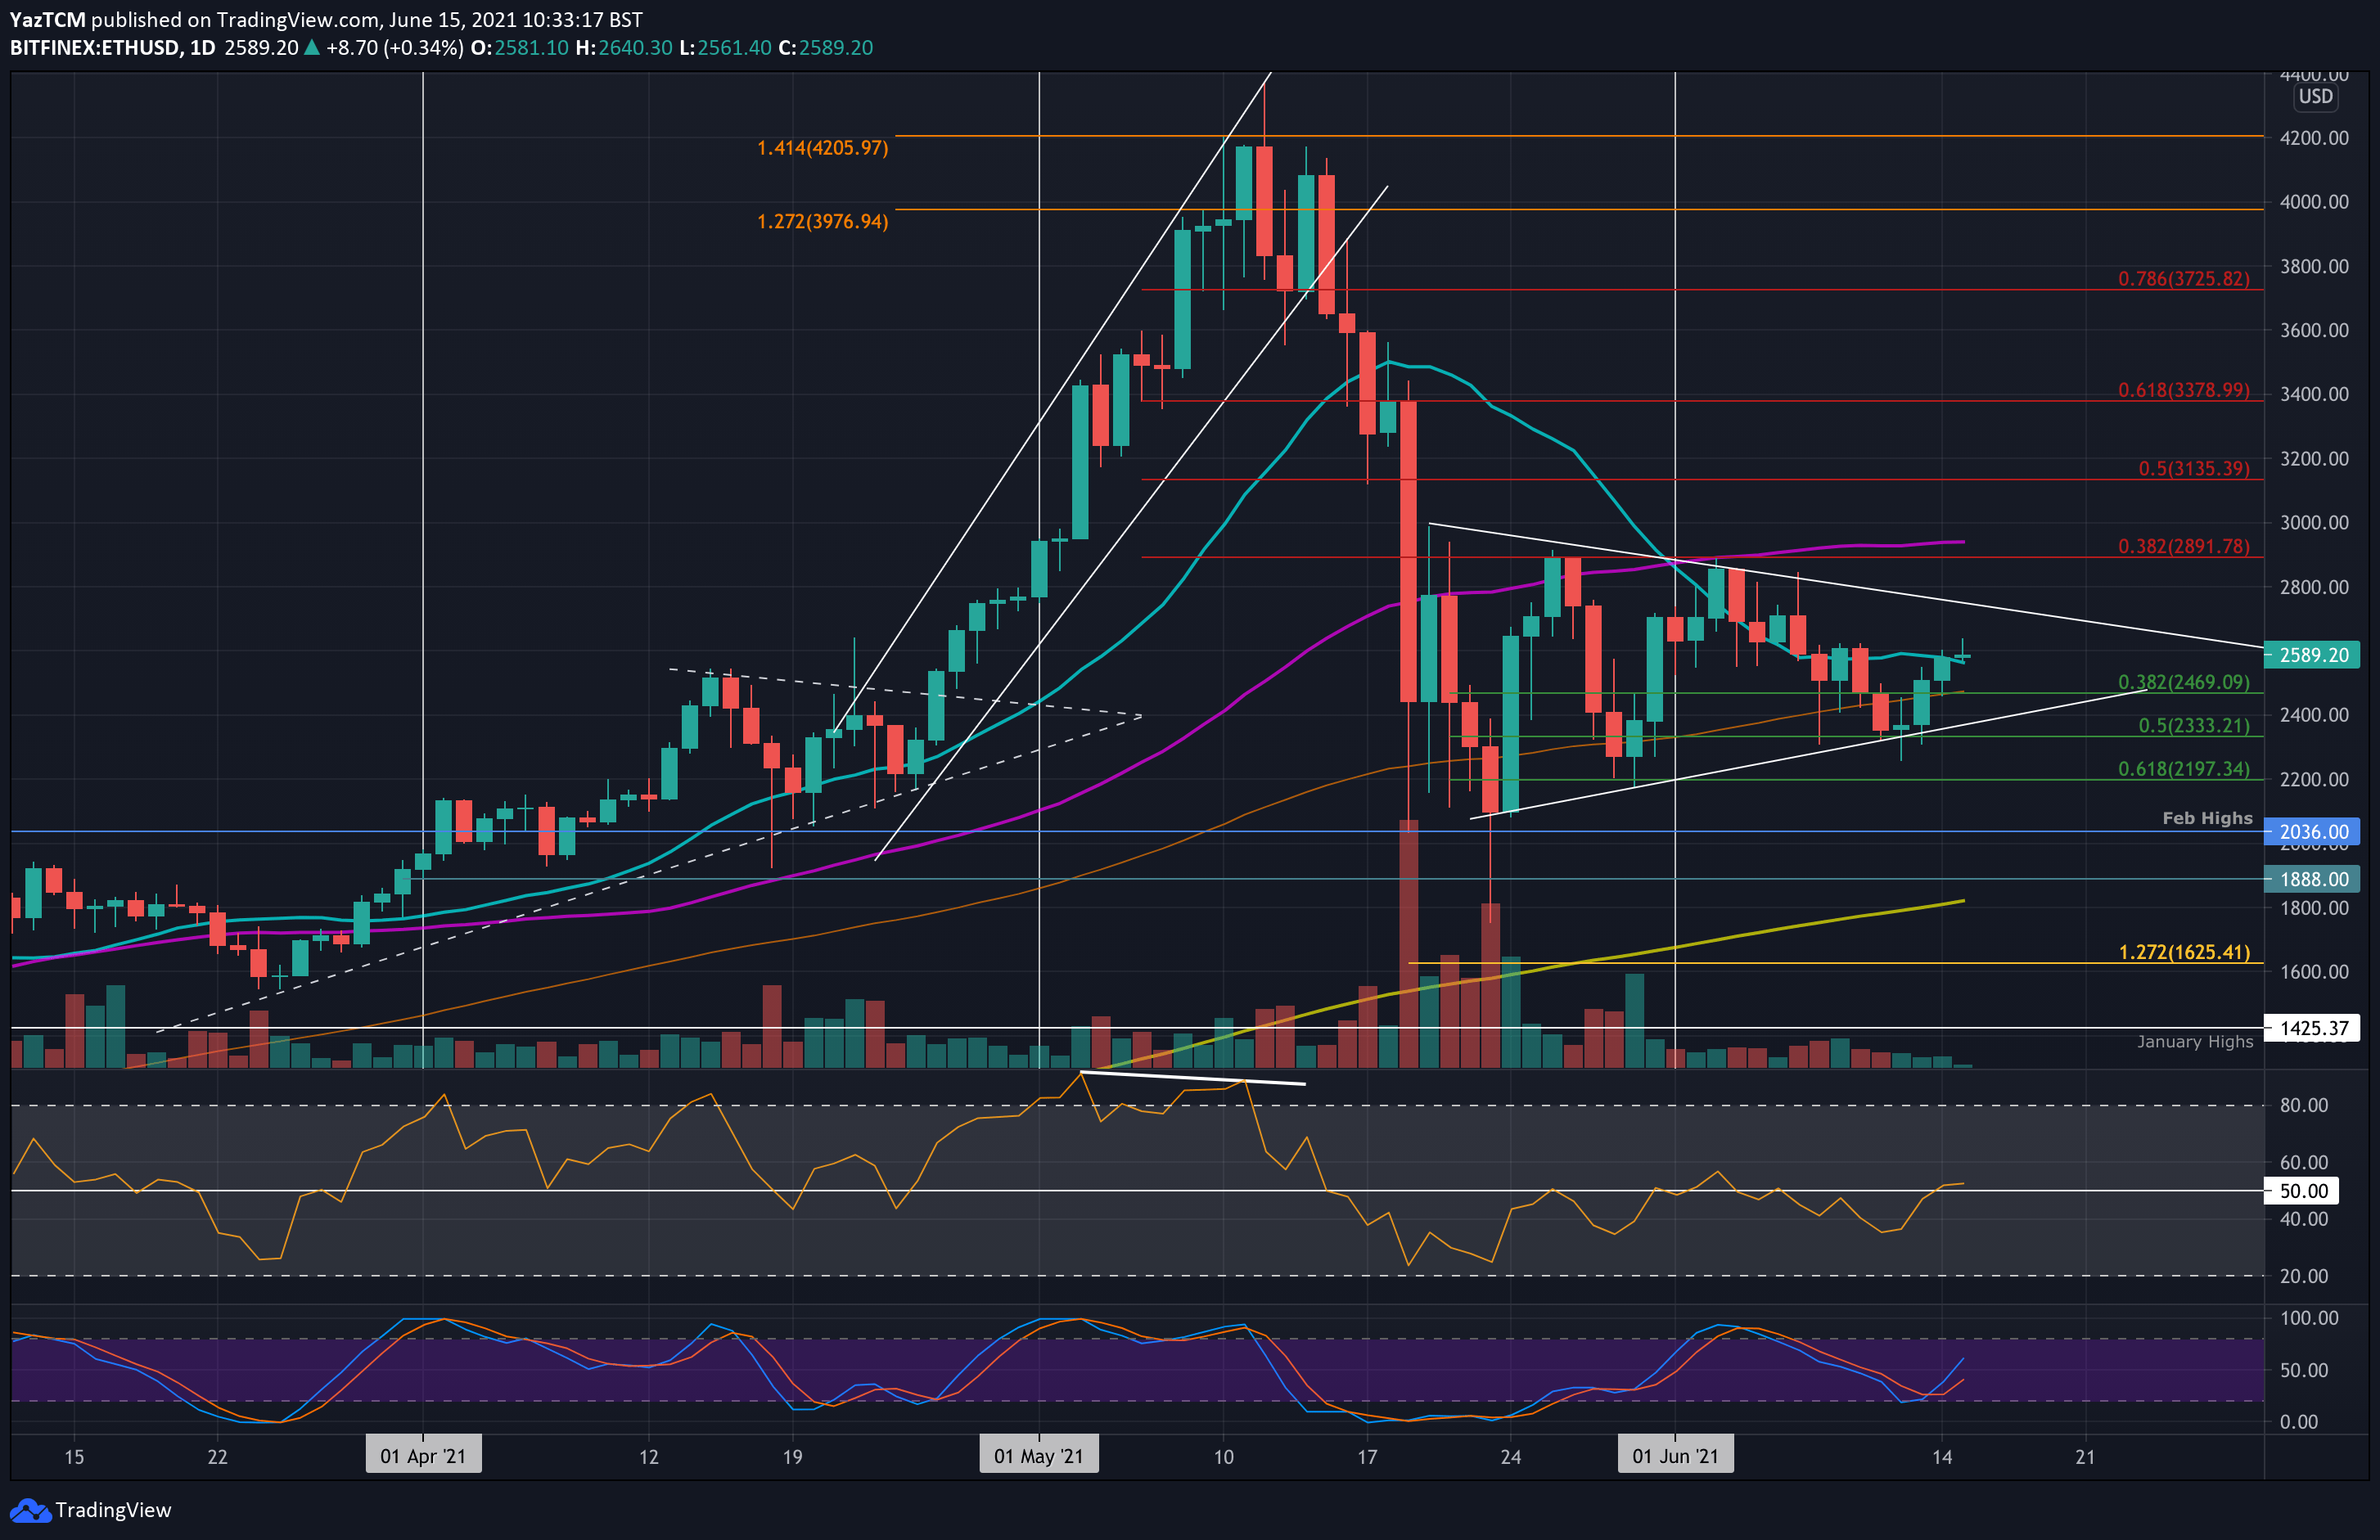
ETH/USD – Bulls Reclaim 20-day MA
Key Support Levels: $2470, $2400, $2333.
Key Resistance Levels: $2600, $2800, $281.
Ethereum bounced from support at $2333 (.5 Fib) over the weekend. There, it formed the lower boundary of a symmetrical triangle pattern and started to head higher. On Sunday, ETH pushed above the 100-day MA at $2470 and continued higher to reach $2600 yesterday.
Today, ETH is sitting above the 20-day MA as it looks to make ground above $2600 and head toward the upper boundary of the current consolidation pattern.
ETH-USD Short Term Price Prediction
Looking ahead, the first resistance above $2600 lies at $2700 (the upper angle of the triangle). This is followed by $2800, $2891 (bearish .382 Fib), $2950 (50-day MA), and $3000.
On the other side, the first support lies at $2470 (.382 Fib & 100-day MA). This is followed by $2400 (lower angle of the triangle), and $2333 (.5 Fib).
The RIS is now sitting above the midline as the buyers attempt to take control of the market momentum. If it can continue higher, the increased bullish momentum should allow ETH to head toward the triangle’s upper boundary.
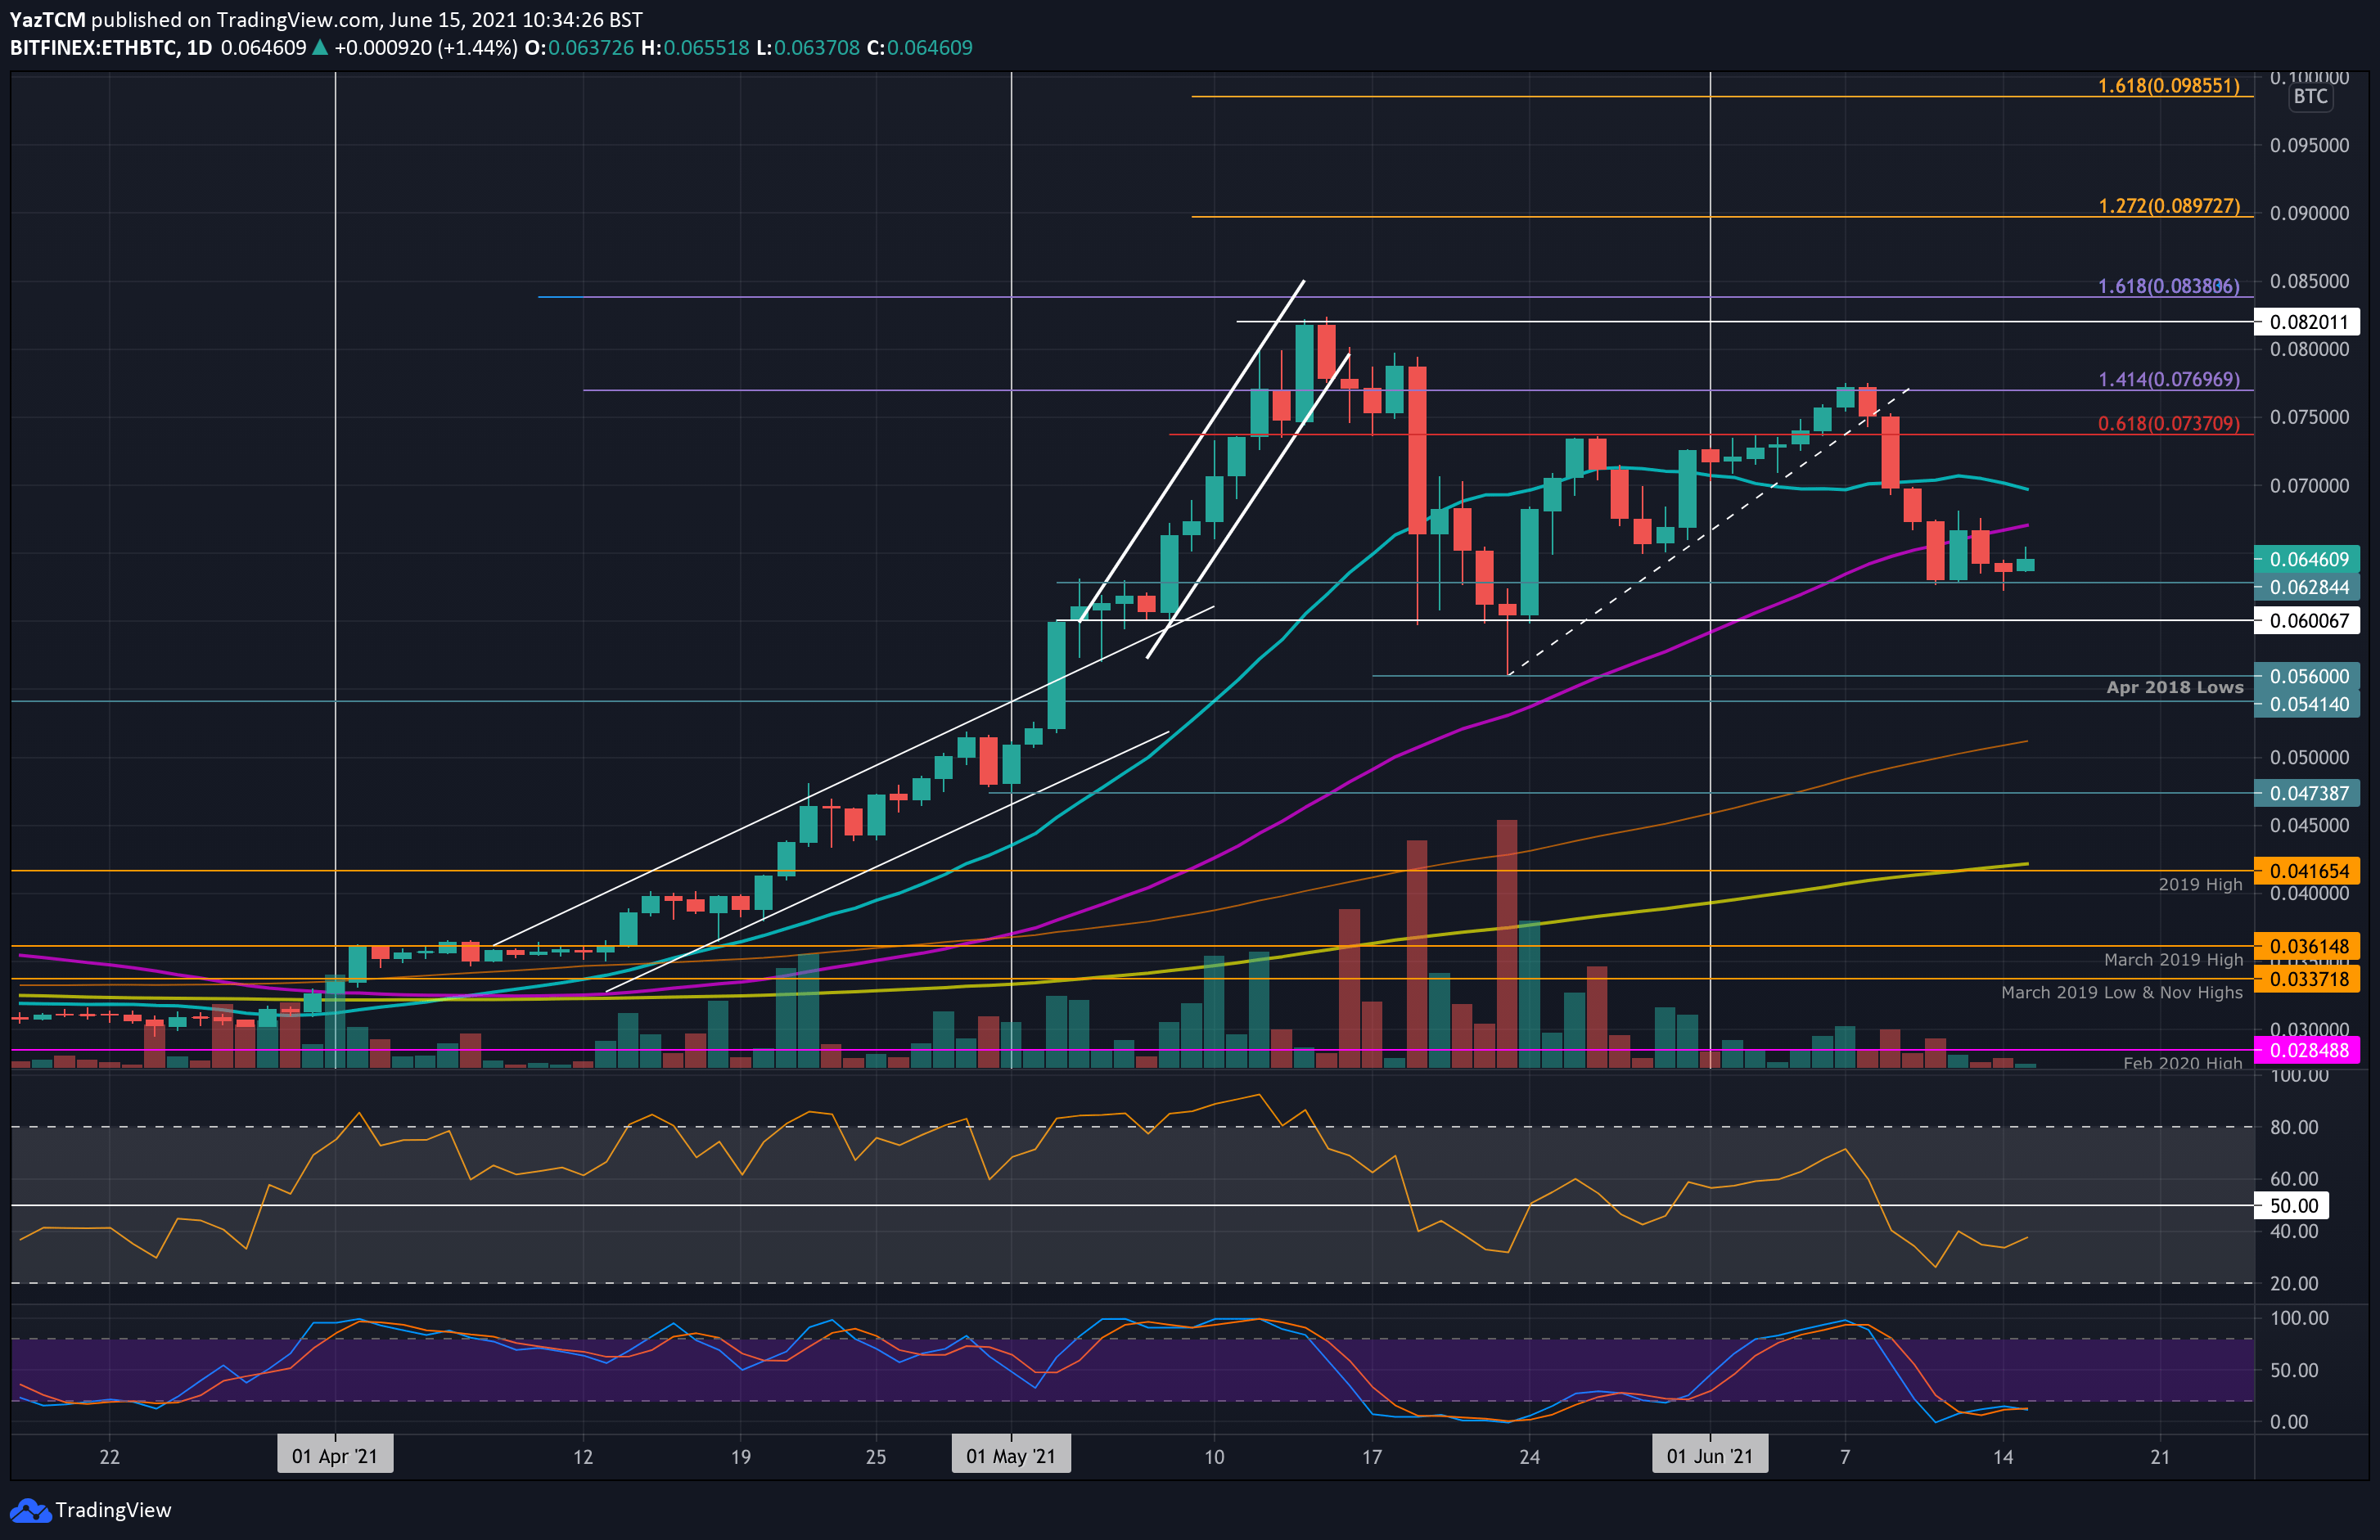
ETH/BTC – Bulls Defend 0.0628 BTC support.
Key Support Levels: 0.0628 BTC, 0.06 BTC, 0.056 BTC.
Key Resistance Levels: 0.065 BTC, 0.067 BTC, 0.07 BTC.
ETH dropped from resistance at 0.077 BTC last week and continued to fall beneath the 50-day MA at 0.065 BTC until support was found at 0.0628 BTC.
Since then, ETH attempted to push higher but was unable to overcome resistance at the 50-day MA. It has dropped lower again but the bulls are battling to maintain the 0.0628 BTC support.
ETH-BTC Short Term Price Prediction
Looking ahead, the first resistance lies at 0.065 BTC. This is followed by 0.067 BTC (50-day MA), 0.07 BTC (20-day MA), and 0.0737 BTC (bearish .618 Fib).
On the other side, the first support lies at 0.0628 BTC. This is followed by 0.06 BTC, 0.056 BTC (late May support), and 0.0541 BTC (April 2018 lows).
The daily RSI remains beneath the midline, indicating that the bears still control the momentum. However, it is showing hints of rising, suggesting that the bearish momentum might be starting to fade.