This is When Bitcoin May Break out of the Downtrend, BTC Price Plunge May Be Short-Lived One!


The post This is When Bitcoin May Break out of the Downtrend, BTC Price Plunge May Be Short-Lived One! appeared first on Coinpedia – Fintech & Cryptocurreny News Media| Crypto Guide
Bitcoin price is not less than a suspense thriller movie nowadays as whenever a breakthrough above $43,000 is close, the asset plunges hard below $41,000. And when we expect a breakdown below the support levels, the asset recovers a bit, consolidates and retest the $43,000 zone.
And hence the BTC price dump may not be taken with huge concern and sensitivity in the upcoming days. Yet these market sentiments, however, may lead to the bloodbath in the crypto space.
The BTC price, no doubt is hovering within a depleting trend yet possesses a notable momentum to hold during the worst plunges.
The asset from the past 10 days is visiting $41,400 support levels multiple times, yet has not plunged below $41,000 yet. And hence manifesting a strong tendency to go parabolic to recover the losses and regain lost positions.
Moreover, the platform has witnessed a growth in the buying volume from the past 10 days. Therefore even if the BTC price falls from the cliff, it may not drop beneath the support levels rather technicals point towards a massive rally ahead.
Bitcoin Price to Rebound ?
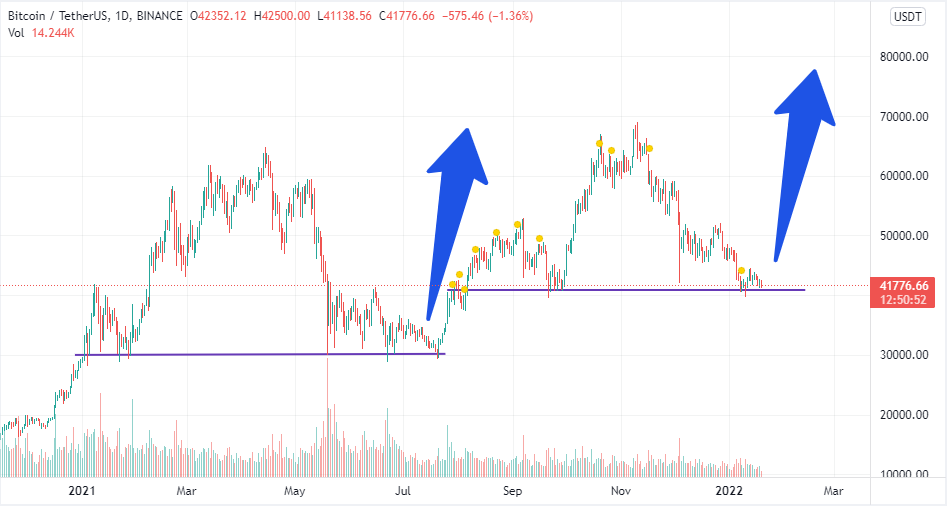
The previous time during the first half of 2021, Bitcoin had formed a huge H&S model which resulted in a 130% jump from the lows. The price ranged from around $30K to as high as $69,000 within a couple of months.
And currently the price has yet again formed a similar pattern which is expected to result in a similar outbreak that may escort the price beyond $80,000.
On the other hand, the Relative Strength Index(RSI) which measures how quickly traders place their bets dragging the asset into the oversold or overbought levels is also manifesting a similar trend.
The traders place their bets at the neckline of the H&S pattern, where the RSI was almost in the overbought region. As the price ranged high RSI maintained a downward trajectory and finally when it was on the verge to smash the oversold region, a gigantic flip raised above the levels.
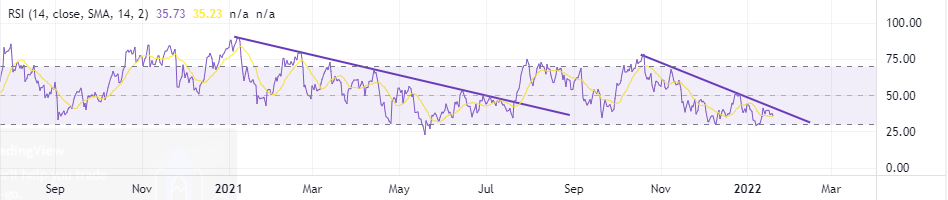
IT is to be noted that the price also flipped with the RSI levels. Currently, the RSI has again reached the apex of the descending triangle and a notable flip seems to be fast approaching.
The rebound could uplift the price initially above $44,000 resistance levels and if it prevents huge correction it may further rally towards $48,000 levels.