Part 2: Quantitative Crypto Insight: Stablecoins and Unstable Yield

By George Liu and Matthew Turk
Tl;dr: This blog analyzes centralized stablecoin lending yield for Compound Finance and shares our insights on performance, volatility, and factors that drive this yield on collateralized lending of stablecoins in DeFi. The analysis shows that this lending yield can outperform the risk-free yield in the TradFi market.

In part two of this quantitative research piece, we will examine stablecoin lending yield for the Compound Finance V2 decentralized finance (DeFi) protocol and share our insights on yield performance, volatility, and what factors are driving yield on collateralized lending of stablecoins through DeFi protocols. We also compare the “risk-free” yield in traditional finance (TradFi) to the concept of “low-risk” yield in DeFi, which we introduced in part one.
ACKNOWLEDGEMENT: While we are aware of the recent collapse of Terra’s algorithmic stablecoin TerraUSD (UST), our analysis here is on the area of collateralized lending yield for centralized stablecoins. We’re focused specifically on Compound for USDC and USDT (fiat-backed stablecoins), which have disparate risks and opportunities.
We conclude in this piece that using stablecoins for low-risk (within DeFi) collateralized lending could outperform the risk-free investment in the traditional financial market.
USDT/USDC Yield Analysis
As mentioned in part one of this blog post, a Compound user who has placed their assets into a liquidity pool can calculate total lending yield using exchangeRate, which is an indication of the value of the interest that the lender can expect to receive over time, and the return from time T1 to T2 can be simply obtained as
R(T1,T2)=exchangeRate(T2)/exchangeRate(T1)-1.
Additionally, annualized yield for this type of collateralized lending (assuming continuous compounding) can be calculated as
Y(T1,T2)=log(exchangeRate(T2)) — log(exchangeRate(T1))/(T2-T1)
While the Compound liquidity pools support many stablecoin assets such USDT, USDC, DAI, FEI etc, we are only going to analyze the top 2 stablecoins here, i.e USDT and USDC, which have a market capitalization of $80B and $53B respectively. Together, they make over 70% of the total market of the stablecoins.
Below are the plots of the annualized daily, weekly, monthly and biannual yields generated according to the formulas in the previous section. The daily yield is somewhat volatile, while the weekly, monthly and biannual yields are respectively the smoothed version of the prior granular plot. USDT and USDC have relatively similar patterns in the plot, as they both experience high yield and high volatility during the start of 2021. This indicates that there are some systematic factors that are affecting the stablecoin lending market as a whole.
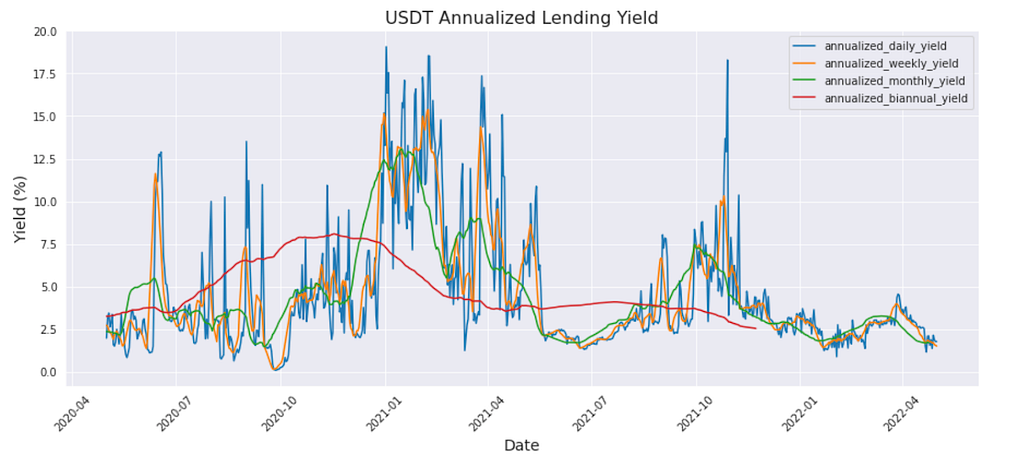
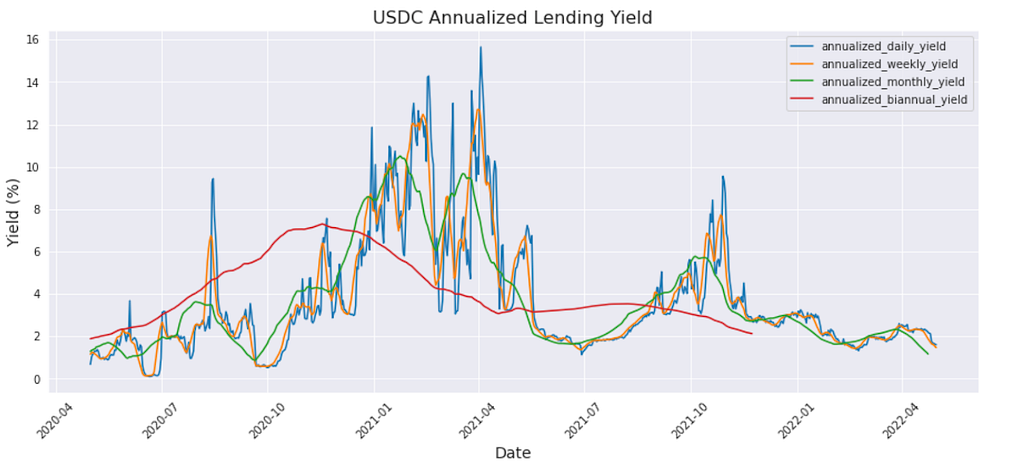
Source: The Graph
One hypothesis of the systematic factors that could affect the lending yield are crypto market data (like the BTC/ETH prices) and its corresponding volatilities. When BTC and ETH are in an ascending trend, some bull-chasing investors may borrow from the stablecoin pools to buy BTC/ETH, and then use the purchased BTC/ETH as collateral to borrow more stablecoins and repeat this cycle until their leverage reaches the desired level. Additionally, when the market enters into a high volatility regime, there are more centralized and decentralized crypto transactions which could increase the demand for stablecoins as well.
Now, to check the relationship of the stablecoin yield and the crypto market data, we perform a simple linear regression analysis to see how much variation in the yield can be attributed to the price and volatility factors using the following formula:
Yield=const+1Mkt_Vol+2Mkt_Price
To measure the magnitude of these factors’ contribution, we use the R-Squared score, which has a range of [0, 100%]. A score of 100% would mean that the yield is completely determined by the contributing factors.
Regression of USDC/USDT on the BTC market and the ETH market respectively lead us to the following R-Squared table:
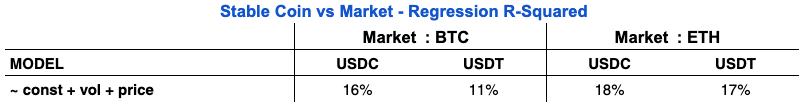
ETH market data has a better explanatory power (18% & 17%) than the BTC market data (16% & 11%) in determining the yield of USDC and USDT. This is unsurprising, particularly due to ETH’s increased popularity and expanded footprint in the DeFi market since the start of 2021. As seen with these results, crypto price and volatility factors did not fully explain the yield in stablecoins. We can conclude that there must be other factors that help to improve the score from the basic model.
We performed further exploratory analysis by introducing the historical stablecoin supply data and MACD technical indicator price data to the model. The stablecoin supply (the total number of stablecoins supplied to Compound liquidity pools) should — intuitively — affect the availability/scarcity of the stablecoins and indirectly impact the yield. MACD is an important momentum trading signal (subtracting the 26 period EMA from the 12 period EMA — in this case on price) as it could help momentum investors to decide when to leverage and when to deleverage.
We see a noticeable increase in R-Squared scores, as both USDC and USDT got a bump to a level around 60%-70% as shown below.
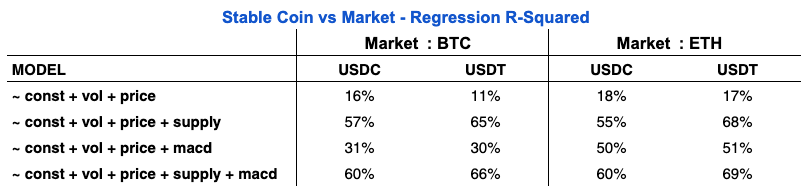
From this data we can conclude that stablecoin supply is a substantial contributing factor, as it alone is able to bring the score to around 60% for both stablecoins in any of the two markets. It seems to suggest that [supply] is a major factor in affecting the yield in the stablecoin lending market. This is very similar to the TradFi world, where credit supply by the Federal Reserve will affect the general interest rate of the whole system.
The introduction of MACD data (on BTC and ETH price) brings mixed improvement. In the case of the BTC market, its independent contribution is far less than the supply factor, and the marginal benefit over the shoulder of supply is only a few percentage points. We noticed in the ETH market, however, that MACD has a greater independent contribution to the R-Squared value as compared to the BTC market. This suggests that stablecoin lending yields are more correlated with momentum based trading activity in ETH than in BTC.
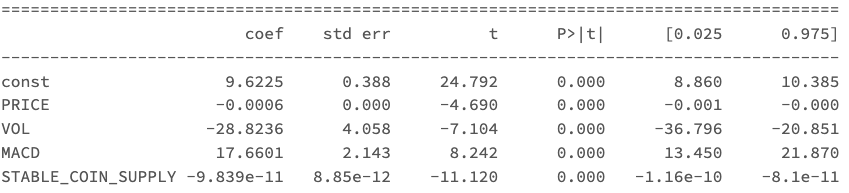
An example of the regression coefficients for USDC lending yield in the ETH market are displayed below. The table suggests that higher ETH prices, volatility and [stable coin supply] are generally associated with lower USDC lending yield. At the same time, the stronger the MACD signal is, the higher the yield would go.
Comparison to the Traditional Risk-Free Yield
While it is interesting to reveal what has driven the low-risk yield on stablecoin lending, it is also important to compare these yields with the counterpart in the TradFi market.
Because stablecoin lending yields are derived from the realized floating interest rates for collateralized loans on the Compound platform, we selected the General Collateral (GC) rate used in the traditional money market as the comparable risk-free rate, because it is also a floating rate with treasury debt as the loan collateral.
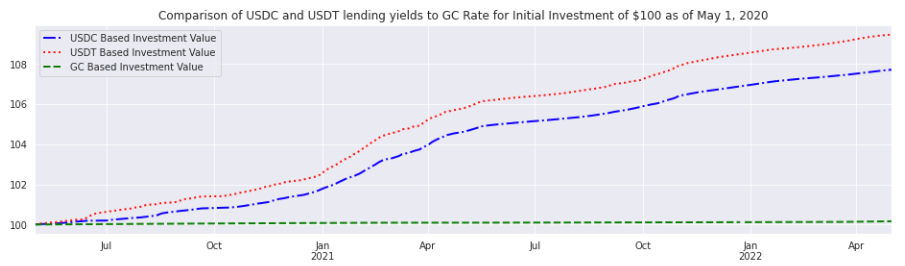
Below is a plot of the portfolio value of the investments that earn USDC lending yield, USDT lending yield, and GC rate yield respectively. The investments all start with $100 initial value on 2020–05–01, and end on 2022–05–01. As seen below, yield on USDT and USDC collateralized lending is higher than the GC rate by a large margin. On the other hand, risk-free investment that earns GC rate hardly grows for the same period.
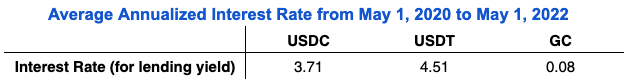
The average interest rate in the table below also confirms that GC rate is on average around 0.08%, while USDC and USDT lending yields are respectively 3.71% and 4.51% for this period as seen below. (We also checked the 2Y term yield on the treasury debt on 2020–05–1 which is merely 0.2%)
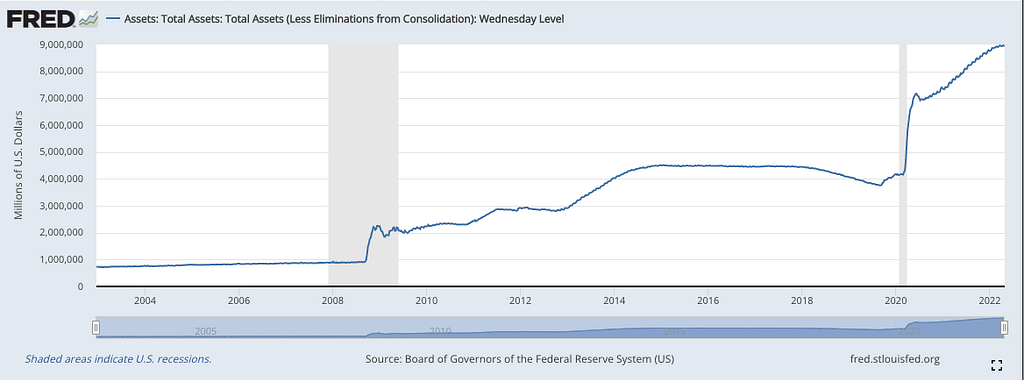
For the foreseeable future, it is reasonable to conclude that the low-risk rate, within the crypto market at least, will continue to outperform the risk-free rate in the TradFi market. One reason for this is the smart contract risk, or liquidation risk mentioned in part one of this blog. However, a larger reason is the slower growth in the stablecoin supply relative to the growth in the crypto economy as a whole. By comparison, the TradFi market has seen major credit growth since the start of the Covid-19 pandemic, which has helped to drive the risk-free rate to historical lows (see Fed balance sheet growth below).
Conclusions
This blog provided a broadly indicative analysis of the low-risk yields available from collateralized lending of stablecoins through DeFi protocols. While these yields may be very volatile on a daily basis, their general trend can be explained relatively well by BTC/ETH prices, volatilities, stablecoin supply and MACD (momentum trading activities). We also compared these yields with the risk-free rate in the TradFi market where we see consistent outperformance in the crypto market. To reiterate, this is not financial advice.
Next steps
We, as part of the Data Science Quantitative Research team, aim to get a holistic understanding of this space from a quantitative perspective. We are looking for people that are passionate in this effort to join our growing team. If you are interested in Data Science and in particular Quantitative Research in crypto, come join us.
The analysis makes use of the Compound v2 subgraph made available through the Graph Protocol. Special thanks to Institutional Research Specialist, David Duong, for his contribution and feedback.
–
NOT INVESTMENT ADVICE
The content is for informational purposes only, is general in nature and should not be relied upon or construed as legal, tax, investment, financial, a promise, guarantee, or other advice. Nothing contained herein constitutes a solicitation, recommendation, endorsement, or offer by Coinbase or its affiliates to buy or sell any cryptocurrency or other instruments in any jurisdiction in which such solicitation or offer would be unlawful under the laws of such jurisdiction.
Part 2: Quantitative Crypto Insight: Stablecoins and Unstable Yield was originally published in The Coinbase Blog on Medium, where people are continuing the conversation by highlighting and responding to this story.