Technical Pricing: 200WMA vs 200DMA approaching key resistance, support levels
Definition
The Mayer Multiple (200D-SMA) 
- The 200-Day Simple Moving Average is a common technical indicator in Technical Analysis, commonly associated with the transition point between a Bull and Bear market.
- The 200 Week Moving Average (200W-SMA)
 The 200-Week Simple Moving Average provides a tool for capturing the baseline momentum of a classic four-year Bitcoin Cycle.
Quick Take
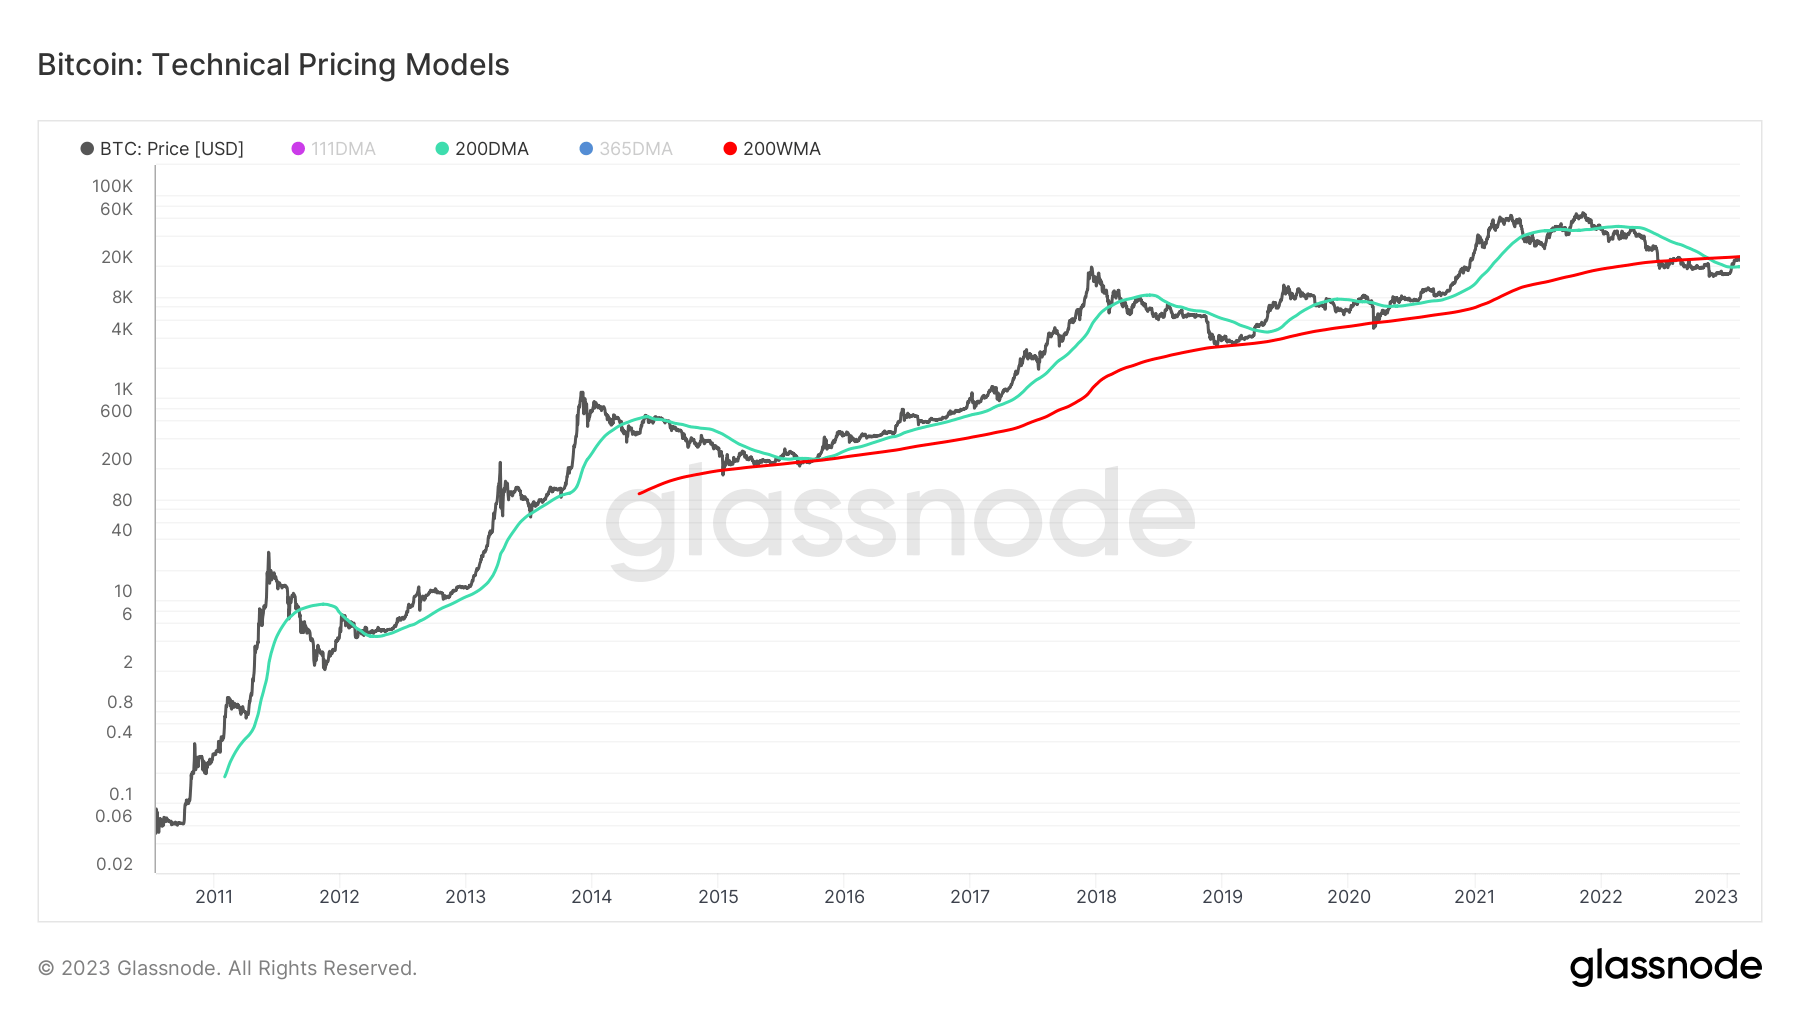
- Through every bear market cycle since Bitcoin’s inception, the price has used the 200 WMA as support. However, it fell below the support level following the collapse of TerraLUNA in June 2022.
- The current 200 WMA is acting as resistance at $24,800.
- While the 200 DMA has been a great indicator for bear markets, as the price has fallen below support in each bear market cycle.
- Bitcoin reclaimed the 200 DMA on Jan. 13, currently priced at $19,700.
The post Technical Pricing: 200WMA vs 200DMA approaching key resistance, support levels appeared first on CryptoSlate.