Solana Price (SOL) Hits $150: Market Dips Look Tempting
Solana started a steady increase above the $135 zone. SOL price broke the $150 resistance and is now consolidating gains.
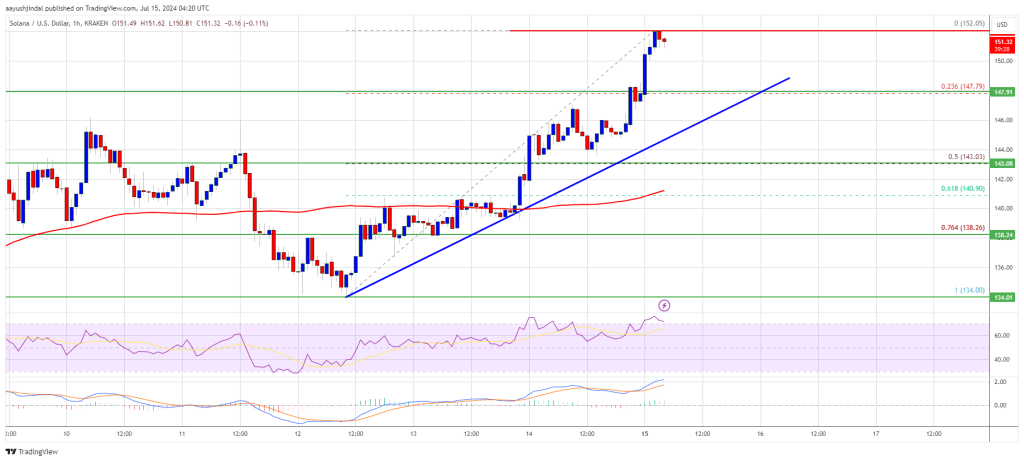
- SOL price started a decent upward move above the $135 resistance against the US Dollar.
- The price is now trading above $145 and the 100-hourly simple moving average.
- There is a connecting bullish trend line forming with support at $147 on the hourly chart of the SOL/USD pair (data source from Kraken).
- The pair could correct lower, but the bulls might remain active near $147 or $143.
Solana Price Jumps Over 5%
Solana price managed to start a fresh increase above the $125 pivot level. SOL gained pace for a move above the $132 and $135 resistance levels, like Bitcoin and Ethereum.
The price even cleared the $145 resistance and surpassed the $150 hurdle. A high was formed at $152.05 and the price is now consolidating gains. It is trading well above the 23.6% Fib retracement level of the upward move from the $134 swing low to the $152 high.
Solana is now trading above the $145 level and the 100-hourly simple moving average. There is also a connecting bullish trend line forming with support at $147 on the hourly chart of the SOL/USD pair.

On the upside, the price might face resistance near the $152 level. The next major resistance is near the $155 level. A successful close above the $155 resistance could set the pace for another steady increase. The next key resistance is near $165. Any more gains might send the price toward the $172 level.
Are Dips Limited in SOL?
If SOL fails to rise above the $152 resistance, it could start a downside correction. Initial support on the downside is near the $150 level. The first major support is near the $147 level and the trend line.
A break below the $147 level might send the price toward $143 or the 50% Fib retracement level of the upward move from the $134 swing low to the $152 high. If there is a close below the $143 support, the price could decline toward the $138 support in the near term.
Technical Indicators
Hourly MACD – The MACD for SOL/USD is gaining pace in the bullish zone.
Hourly Hours RSI (Relative Strength Index) – The RSI for SOL/USD is above the 50 level.
Major Support Levels – $147 and $143.
Major Resistance Levels – $152 and $155.