Bitcoin Price Analysis: Massive Volatility for BTC Around $64K but What’s Next?
Bitcoin’s price demonstrates clear signs of recovery, with the market reclaiming some key levels. Investors are now hopeful that the correction phase is finally over.
Technical Analysis
By TradingRage
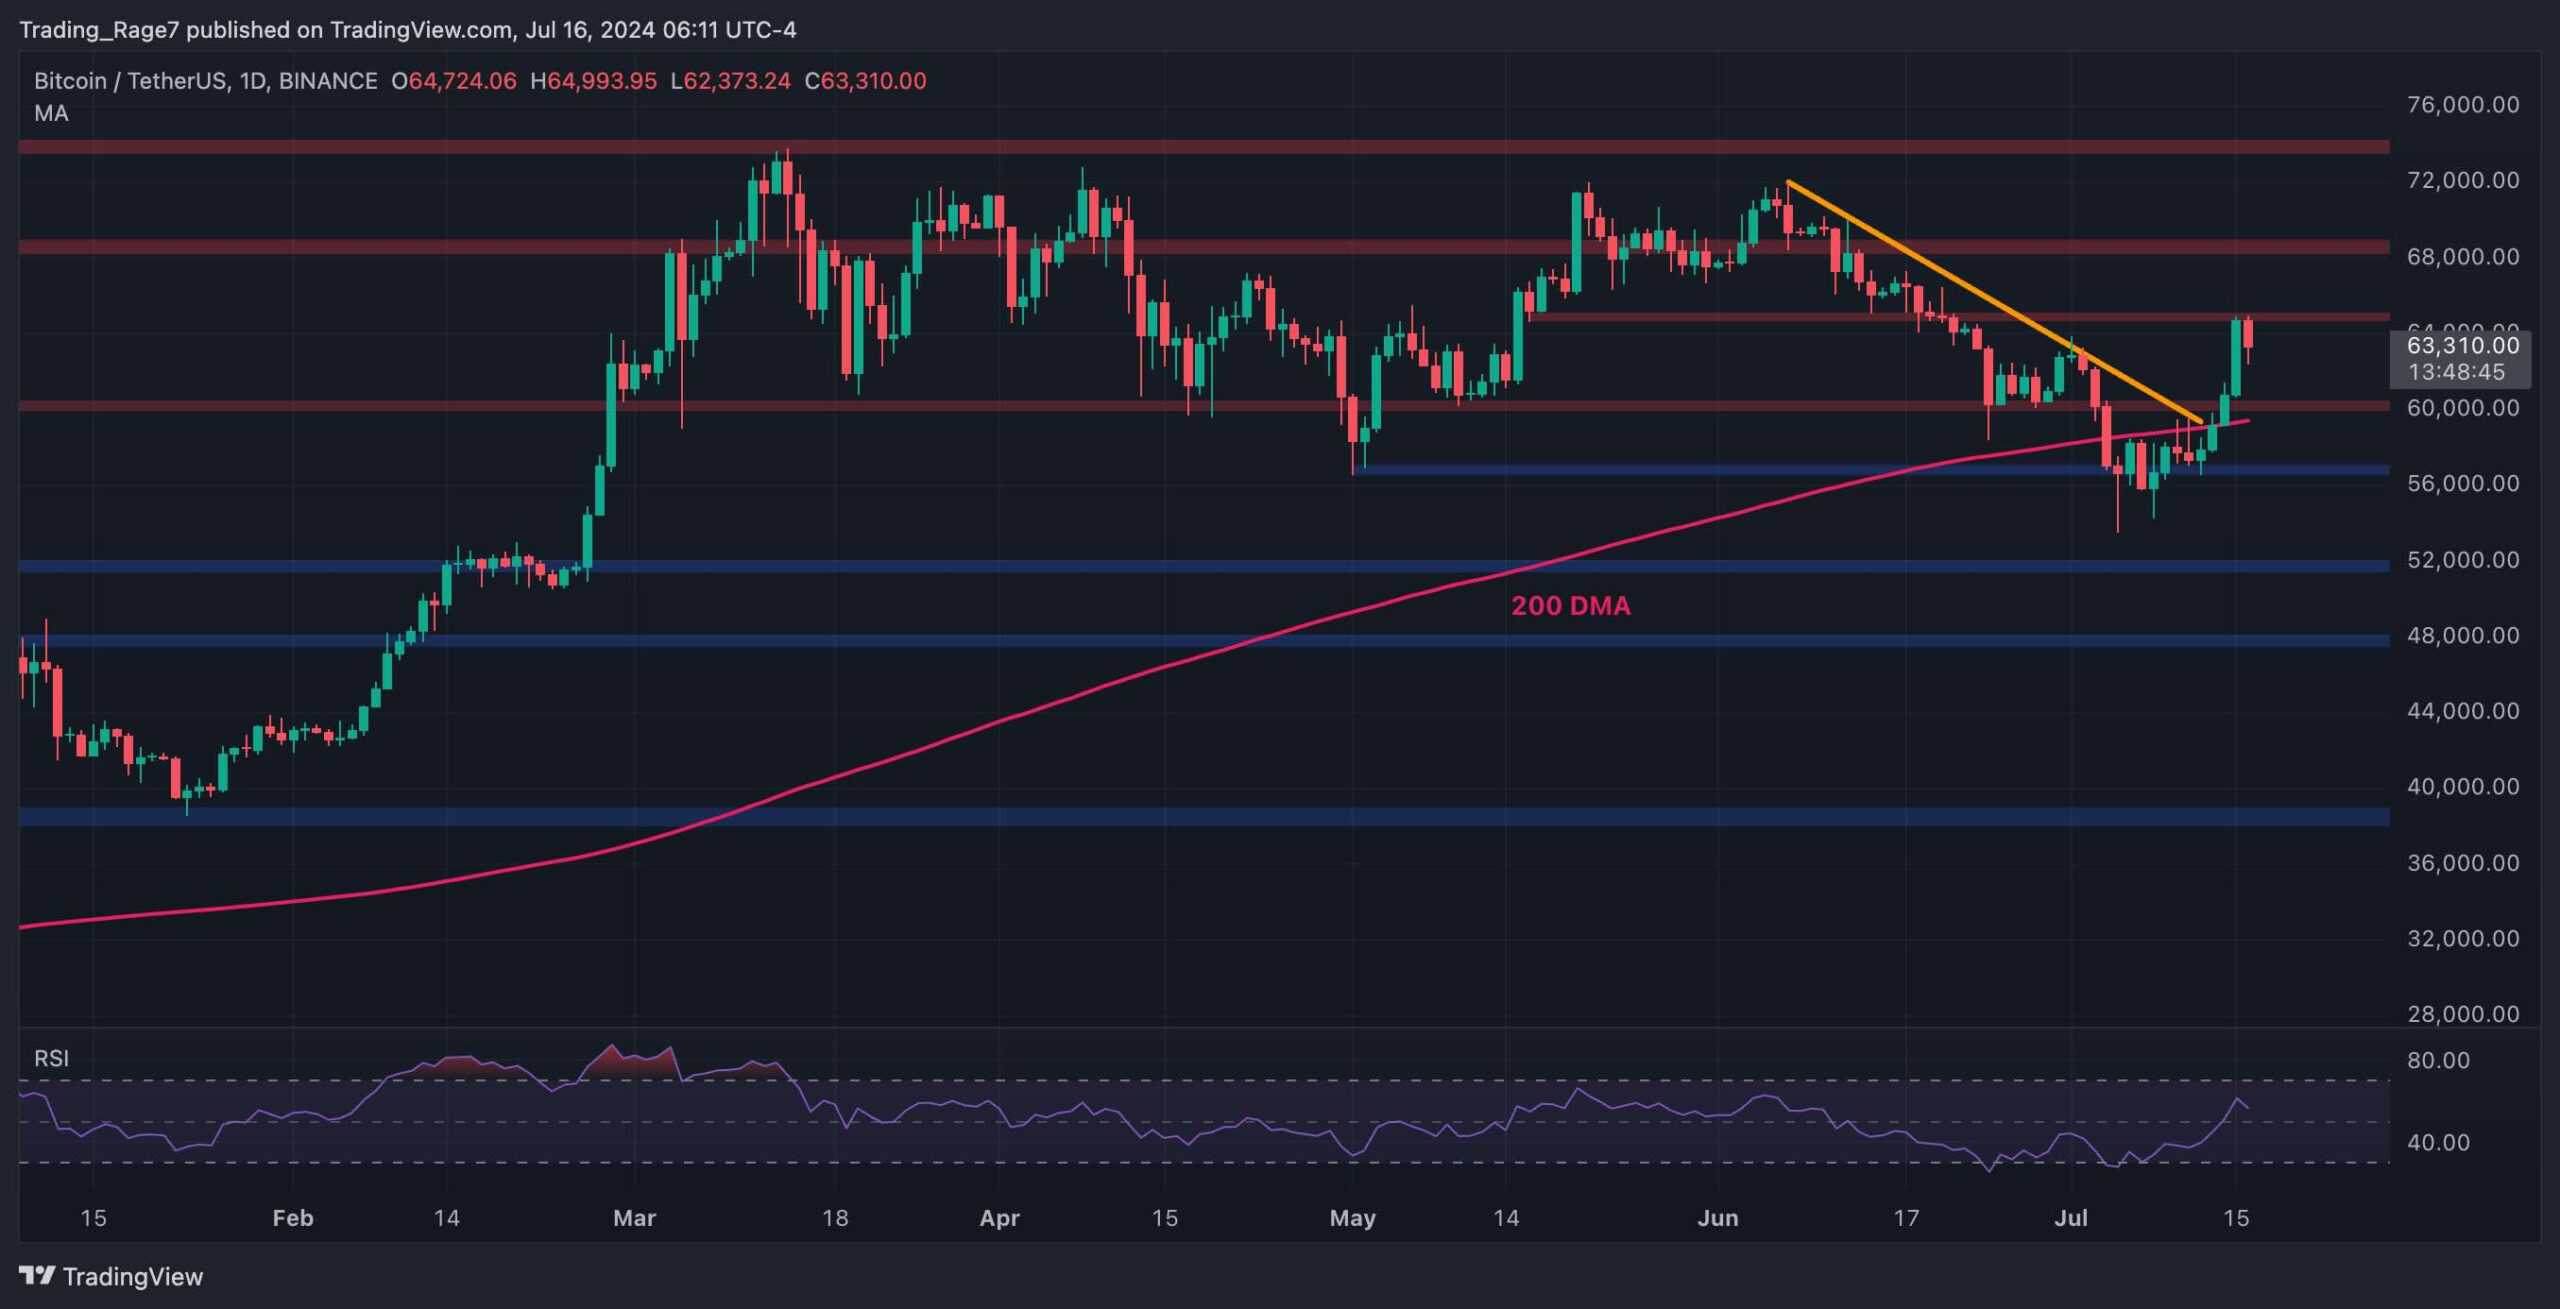
The Daily Chart
On the daily timeframe, the price has recently demonstrated an impulsive recovery from the $56K support level, breaking through several resistance elements. The 200-day moving average, located around the $59K mark, the bearish trendline, and the $60K resistance level have all been broken to the upside.
Yet, the $65K resistance level prevents a continuation higher. Meanwhile, the RSI shows that the momentum favors a bullish move. It seems like a matter of time before the market rallies higher and even creates a new all-time high.

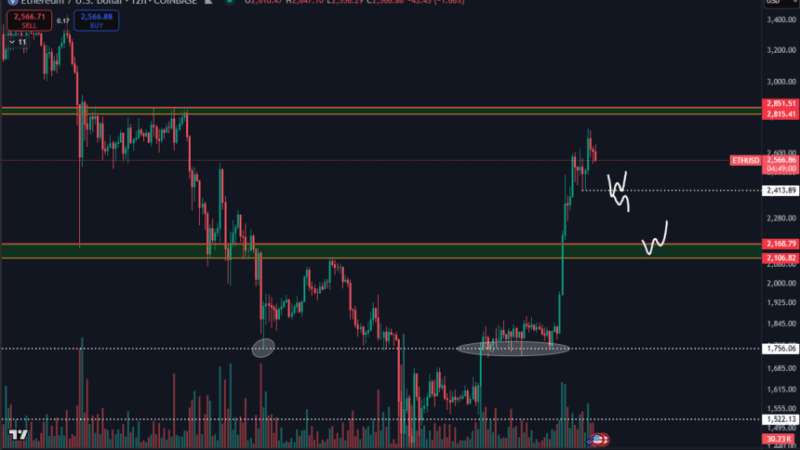
The 4-Hour Chart
Looking at the 4-hour chart, it is evident that the price has been making higher highs and lows since two fake breakouts below the $57K support level.
The price has also broken through the bearish trendline and the $60K level without hesitation. Yet, the market’s reaction to the $65K resistance level indicates that it might pull back to the $60K level before continuing its upward move.

On-Chain Analysis
By TradingRage
Bitcoin Exchange Reserve
With Bitcoin’s price finally recovering from below the $60K mark, analyzing the behaviour of investors using on-chain metrics can yield both reasons for the recent recovery and indications for the future.
This chart displays the Bitcoin Exchange Reserve metric, which measures the amount of BTC held on exchange wallets. Rises in the reserves indicate that investors are depositing their coins to exchanges for selling (most probably), while decreases show accumulation by the holders.
As the chart suggests, the exchange reserve metric has been dropping rapidly in recent weeks, indicating that many large investors have used the recent correction and bought the dip, and now, they are withdrawing their coins to store for the long term. This supply shrink can lead to a sustainable rally in the upcoming months.

The post Bitcoin Price Analysis: Massive Volatility for BTC Around $64K but What’s Next? appeared first on CryptoPotato.