Bitcoin Bullish: Sharp Reversal From Nearly $70K, Creating Higher Highs And Higher Lows


The post Bitcoin Bullish: Sharp Reversal From Nearly $70K, Creating Higher Highs And Higher Lows appeared first on Coinpedia Fintech News
Bitcoin price made a sharp pullback from nearly $70,000 in early sessions of Tuesday after traders turned speculative about the US Government may sell the seized crypto assets.
The speculations were raised when Arkham Analytics revealed the US government’s transfer of $2 billion worth of Bitcoin to 2 new wallet addresses.
Amid this chaos, the BTC price reacted negatively and lost the $69K territory, currently trading at $66,443 with 24-hour growth of -3.84%.
Traders love this pattern of Bitcoin
Bitcoin in 2024 has been repeating this pattern where the asset is rising to key levels of strong physiological resistance and rejecting down to major support zones.
As seen at the beginning of 2024 mid-January, BTC reached a multi-year high of $47000 after the Bitcoin Spot ETF was released. This surge was immediately reversed and Bitcoin dumped below $40,000 in the next few days, just to start a new surge.
A similar move was seen in early March when the price hit a new time high at $69,000 and fell to below $60,000 in the next few hours.
Later in the same month, Bitcoin pulled back again from its all-time high of $73,500, and post months from then this level was challenged again.
This price action may be a concern for leveraged traders but the spot and futures traders see this as a strong technical indicator. Bitcoin has been making higher highs and higher lows, which is considered to be a Bullish pattern in the short, mid, and long term.
It is also impressive that in early July Bitcoin dipped below $54000 after the German government started selling their Bitcoins, and just 2 days to close the month, BTC is at $66K. Representing a good gain margin from its beginning in the month of $63000.
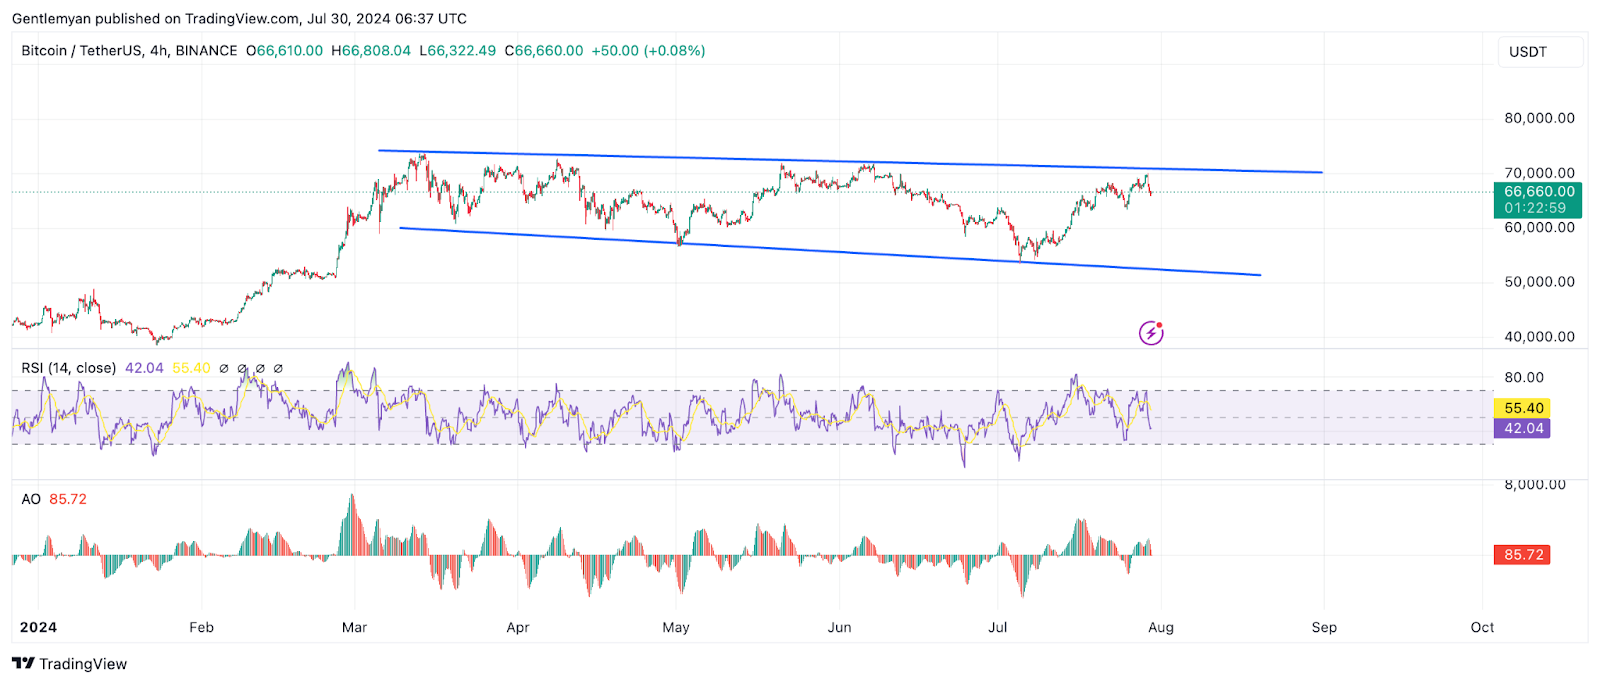
Bitcoin Analysis
The BTC/USDT 4hr chart shows Bitcoin price actions continue in the Widening wedge pattern, also an ascending trend line is created.
The price today was rejected at the weekly resistance of $69,648 and now trading at $66,600.
Notably, RSI at 42 and Awesome above the neutral level of 50 shows a reversal of bullish momentum.
A breakout above $69000 would provide support to $70K and further push toward An all-time high. This can happen if the US political news and ETF outflow are neutralized.
Conversely, if Bitcoin falls below $65000, this will bring it to the 50-day EMA price and make $64,000 as a Key support.