Introducing Kraken Labs, an innovative experiment in crypto data visualization
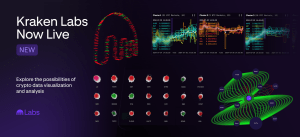

We’re thrilled to unveil Kraken Labs, initially launching as a suite of five interactive data visualization modules created by staff designer Benno Gerrit Wissing.
These experiments leverage both Kraken-derived and onchain data to explore the limitless possibilities of crypto data visualization, ranging from highly exploratory and abstract 3D real-time data visualizations to insight-driven experiments that use time-series clustering and pattern recognition.
We’ve decided to make these public to share what’s possible with the wider crypto community and build upon the growing set of data visualization experiments.
Kraken Labs currently includes the following experiments:
Evo
Customizable 3D objects each representing a Kraken market. These objects use visual cues to convey the temporal evolution of real-time market data.
The experiment encodes various market data dimensions (volume, change, high/low range, spread, market updates per minute) in 3D object properties (size, color, noise scale, noise strength, noise speed) to visualize multiple markets for quick insights on their activity at a glance:

Cluster
Markets are grouped together by similar chart patterns. This provides a meta-view of the markets so that instead of analyzing Kraken’s (almost 300) individual USD markets, an algorithm sorts these markets into two to six major groups that evolve similarly, which is useful for diversification purposes.
The additional “list view” orders markets by their similarity relative to all analyzed markets to easily identify anomalous (low similarity) and generic (high similarity) markets:

Patterns
Analytics that visually uncover chart patterns within any individual Kraken USD market. These patterns highlight recurring, anomalous, and evolving sequences over the past day to year. Each pattern type can be inspected more closely upon interaction by hovering or selecting on the chart.
In the detailed pattern view, instances of recurring patterns are overlaid on each other to easily see how similar they are, while evolving patterns are stacked on top of each other to visualize their change over time. Patterns of various widths (i.e. close price data points) can be identified according to user preference:

Beast
This visualization displays daily live-streamed candlesticks of every USD trading pair on the Kraken exchange. These candles are presented in the shape of Kraken’s iconic beast logo.
By selecting an individual asset, an interactive 3D candlestick chart of that market is revealed so that it can be inspected from a granular perspective. This allows the performance of all Kraken markets to be seen at once and individually in a concise and compelling way:

Graph
A tool to visualize the flow of onchain transactions between addresses as a network. Each node represents an address and each edge a transaction. Every address node and transaction edge can be selected to retrieve additional information.
Selected nodes highlight the transaction flow from those respective addresses. Graph tells a visual story of an address and its transaction partners:

Leveraging our crypto expertise for the benefit of our clients
As one of the longest standing exchanges in the crypto industry, we have accrued a wealth of crypto knowledge. With the development of Kraken Labs, we’re committed to leveraging this knowledge to empower our clients, providing them with cutting-edge tools and services to help better navigate markets.
We encourage you to share your feedback on these modules, which can be provided on any of the individual module pages. Your input is crucial in shaping the Kraken Labs experiment.
The initial modules are just the beginning: Kraken Labs is pushing the boundaries of data visualization to uncover novel frameworks for analyzing crypto markets. Stay tuned for more visually stunning experiments within Kraken Labs and possible integrations with our full product suite.
Experience the future of crypto data visualization today:
These materials are for general information purposes only and are not investment advice or a recommendation or solicitation to buy, sell, stake, or hold any cryptoasset or to engage in any specific trading strategy. Kraken makes no representation or warranty of any kind, express or implied, as to the
accuracy, completeness, timeliness, suitability or validity of any such information and will not be liable for any errors, omissions, or delays in this information or any losses, injuries, or damages arising from its display or use. Kraken does not and will not work to increase or decrease the price of any particular cryptoasset it makes available. Some crypto products and markets are unregulated, and you may not be protected by government compensation and/or regulatory protection schemes. The unpredictable nature of the cryptoasset markets can lead to loss of funds. Tax may be payable on any return and/or on any increase in the value of your cryptoassets and you should seek independent advice on your taxation position. Geographic restrictions may apply.
The post Introducing Kraken Labs, an innovative experiment in crypto data visualization appeared first on Kraken Blog.


