Solana outperforms Ethereum despite 10% price drop

The post Solana outperforms Ethereum despite 10% price drop appeared first on Coinpedia Fintech News
Solana (SOL) the world’s fifth-biggest cryptocurrency has outperformed Ethereum (ETH) in terms of price surge and trading volume over the last 30 days. Today, on August 1, 2024, a blockchain media outlet Wu Blockchain made a post on X (previously Twitter) stating that Solana has surpassed Ethereum in monthly Decentralized Exchange (DEX) trading volume.
Solana outperforms Ethereum
According to the post on X, this is the first time since July 2024, that Solana’s monthly DEX trading volume reached $55.876 billion, while Ethereum experienced a monthly DEX trading volume of $53.86 billion only.
Besides Solana’s monthly DEX trading volume, other chains have also performed impressively well. According to an on-chain analytic firm DefiLama, chains such as Arbitrum, BSC, and Base have experienced a monthly trading volume of $24.569 billion, $17.888 billion, and $15.554 billion, respectively.
Apart from DEX trading volume, Solana (SOL) has also outperformed Ethereum (ETH) in terms of price surge. According to Coinmarketcap, SOL experienced a price surge of over 10% in the last 30 trading days. During the same period, ETH has lost over 10% of its value.
SOL price-performance analysis
At press time, SOL is trading near $161 and has experienced a 12% downside momentum in the last 24 hours. Following this significant drop, SOL’s trading volume jumps by 68%. This increase in trading volume during a bearish market indicates a higher level of participation from investors and traders.
Solana price prediction
According to expert technical analysis, SOL is currently at an important support level of $161 and appears highly bearish. If SOL fails to maintain this level, there is a high chance it could fall to $150, its next support level.
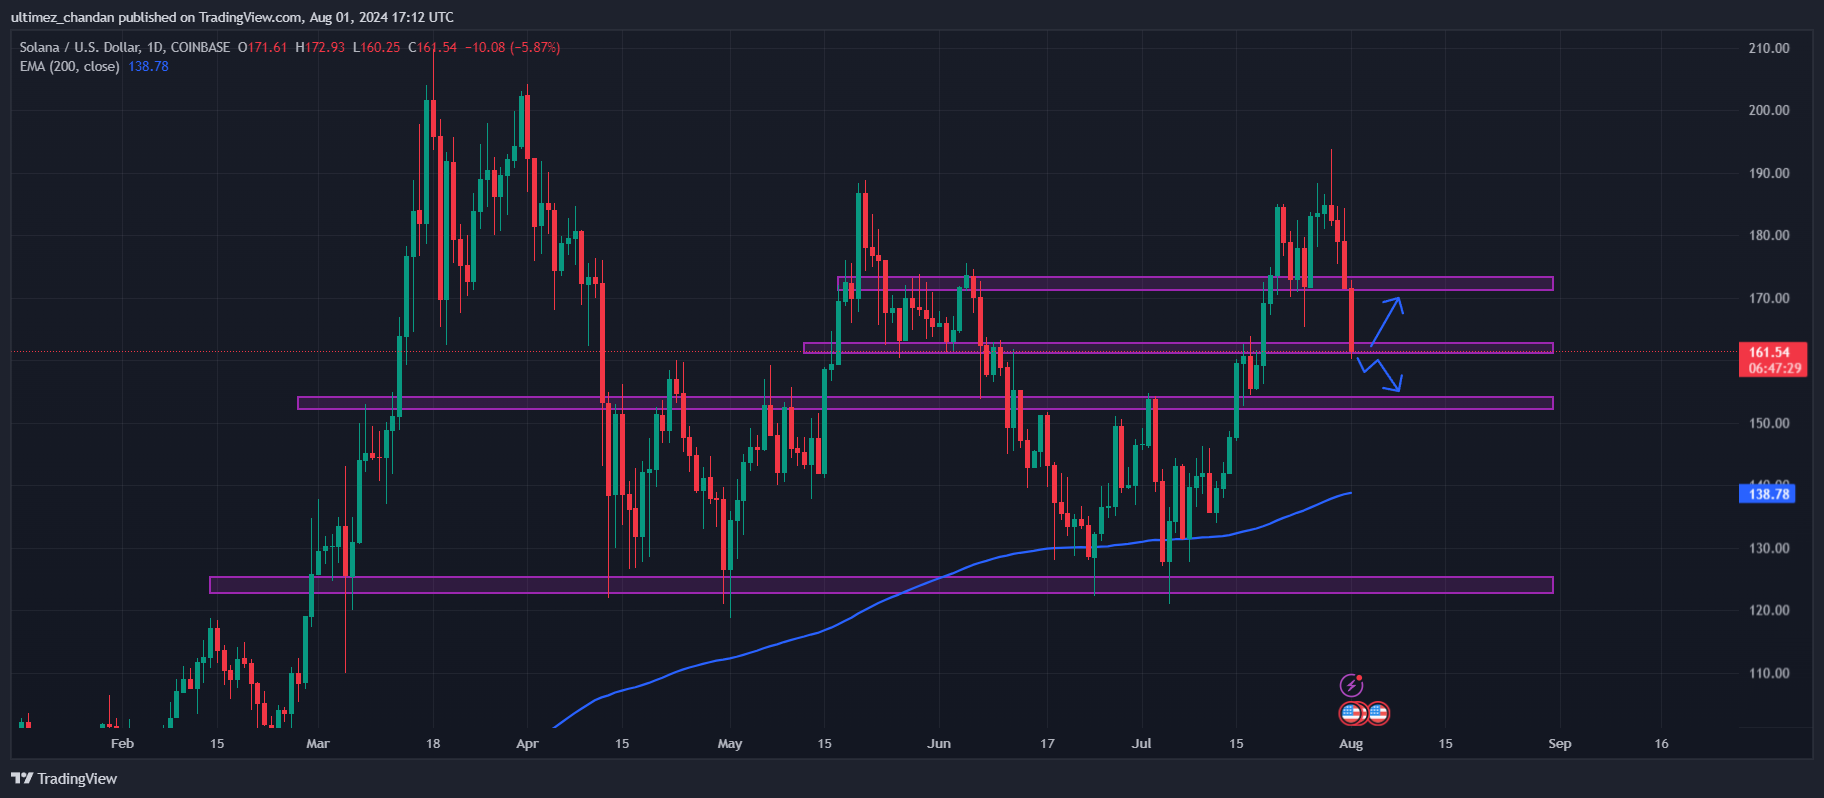
Despite this massive bearish outlook, SOL is still trading above the 200 Exponential Moving Average (EMA) on a daily timeframe. The price of assets above 200 EMA suggests that assets are still bullish on a higher timeframe.