XRP Price Trapped in a Tight Range: Will It Break Free?

ItXRP price remained in a tight range below the $0.60 barrier. The price could extend losses if there is a close below the $0.5550 support zone.
- XRP price started a consolidation phase below the $0.600 zone.
- The price is now trading below $0.5750 and the 100-hourly Simple Moving Average.
- There is a connecting bearish trend line forming with resistance at $0.570 on the hourly chart of the XRP/USD pair (data source from Kraken).
- The pair could attempt a recovery wave if it clears the $0.5750 resistance zone.
XRP Price Starts Consolidation
XRP price remained stable above the $0.5550 support like Bitcoin and Ethereum. The price attempted a recovery wave, but it was short-lived. It climbed above the $0.5650 level and tested $0.5750 before there was another decline.
The price retested the $0.5550 support. A low was formed at $0.5567 and the price is now consolidating losses. It managed to rise above the 23.6% Fib retracement level of the recent decline from the $0.5767 swing high to the $0.5567 low.
The price is still trading below $0.5750 and the 100-hourly Simple Moving Average. On the upside, the price might face resistance near the $0.5680 level. The first major resistance is near the $0.570 level. There is also a connecting bearish trend line forming with resistance at $0.570 on the hourly chart of the XRP/USD pair.
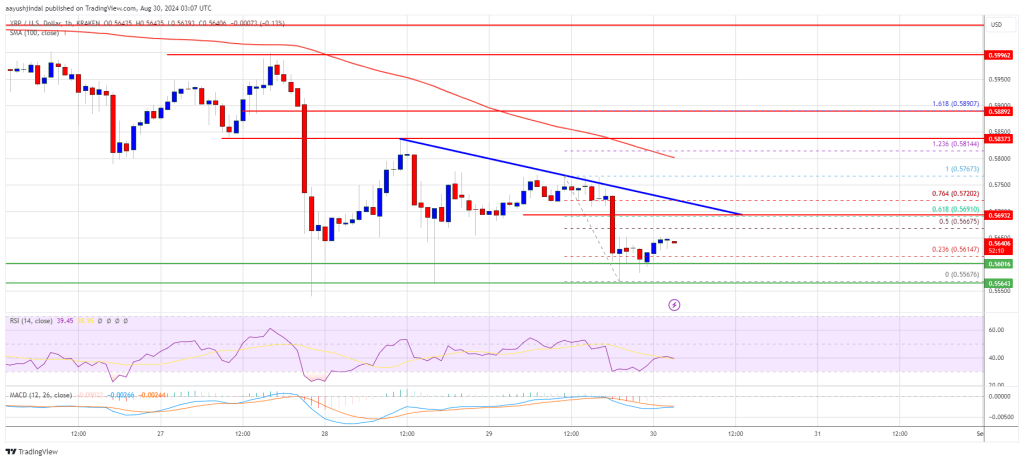
The trend line is close to the 61.8% Fib retracement level of the recent decline from the $0.5767 swing high to the $0.5567 low. The next key resistance could be $0.5750. A clear move above the $0.5750 resistance might send the price toward the $0.5850 resistance. The next major resistance is near the $0.6020 level. Any more gains might send the price toward the $0.6160 resistance or even $0.6250 in the near term.
More Losses?
If XRP fails to clear the $0.570 resistance zone, it could start another decline. Initial support on the downside is near the $0.560 level. The next major support is at $0.5550.
If there is a downside break and a close below the $0.5550 level, the price might continue to decline toward the $0.5320 support in the near term. The next major support sits at $0.5120.
Technical Indicators
Hourly MACD – The MACD for XRP/USD is now losing pace in the bearish zone.
Hourly RSI (Relative Strength Index) – The RSI for XRP/USD is now below the 50 level.
Major Support Levels – $0.5600 and $0.5550.
Major Resistance Levels – $0.5700 and $0.5850.