Bitcoin Reclaims $63,000 After US Fed Rate Cut, But Is This Rally For Real?
So far, Bitcoin has seen a mixture of bulls and bears just in the past day alone. Although bulls appear to be taking the lead given its current market performance, will this be sustainable?
Before the US Federal Reserve announcement of the rate cuts, Bitcoin experienced a slight dip in its trading price. However, following the announcement, the leading crypto saw a sudden price surge, reclaiming the $60,000 mark.
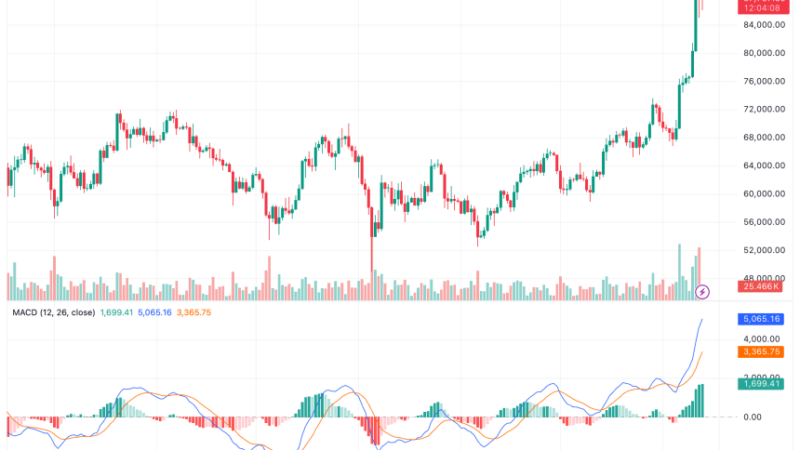
Bitcoin continues to show bullish strength, trading at $63,006, reflecting a 5.6% increase over the past 24 hours.
Is This Bitcoin Rally For Real?
The sudden bullish performance from Bitcoin recorded over the past day has had several traders and analysts sharing their respective outlooks on the asset, with many focusing on the next potential trajectory of Bitcoin’s price.
Despite the ongoing upward momentum, some experts urge caution, highlighting underlying market signals that could impact the sustainability of this bullish trend.
One such expert, crypto trader Josh Olszewicz, shared his insights on this matter, suggesting that while the current picture appears optimistic, there are still some concerns to consider before expecting a continued uptrend.
According to Olszewicz, Bitcoin’s recent move led it above the daily Ichimoku Cloud—a technical analysis indicator used to gauge market trends—signaling a potential bullish scenario.
However, he emphasized that this indicator alone does not guarantee a sustained upward trend. Specifically, Olszewicz pointed out that the Cloud and the Tenkan-Sen and Kijun-Sen (TK) cross are still in a bearish formation.
We are once again back above the daily Cloud, although we still have a bearish Cloud and bearish TK cross.
Additionally, the previous three Kumo breakouts this year have gone no where. So although this is a certainly more bullish picture than a few days ago, Cloud does… pic.twitter.com/bmlqKM9g6c
— #333kByJuly2025 (@CarpeNoctom) September 19, 2024
What Will Result In A Sustainable Rally?
For a more definitive bullish signal, the Cloud needs to flip into a bullish mode, along with a bullish TK cross, Olszewicz disclosed. This setup would provide a stronger confirmation for a bullish continuation.
Olszewicz also noted that previous Kumo breakouts this year have failed to lead to significant price gains, adding uncertainty to the current breakout.
He suggested that analyzing Bitcoin on a longer timeframe, such as the two-day Ichimoku Cloud, might offer a clearer perspective.
A bullish breakout on this timeframe and an eventual bullish TK cross could provide a more reliable indication of a sustained bullish trend for Bitcoin.
Featured image created with DALL-E, Chart from TradingView


