Chainlink Price Forms Breakout Setup as Inflows Rise: What Charts Reveal

The post Chainlink Price Forms Breakout Setup as Inflows Rise: What Charts Reveal appeared first on Coinpedia Fintech News
Chainlink price has been quietly building strength while much of the crypto market struggles to regain momentum. Despite broader uncertainty and volatility across major altcoins, LINK has managed to hold a critical support region while gradually tightening its price range. This type of compression often appears before major directional moves, and the latest on-chain data suggests investors are still positioning around the Chainlink ecosystem.
At the same time, LINK price is now trading close to a key descending resistance trendline, raising an important question for traders: Is Chainlink preparing for a breakout rally, or will the consolidation continue? A closer look at capital flows and the chart structure may provide the answer.
LINK Attracts Fresh Capital Despite Market Weakness
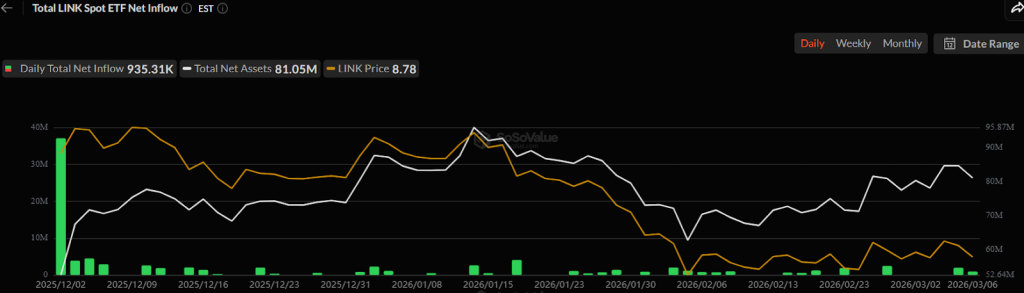
One of the most notable signals supporting the current Chainlink price outlook is the steady inflow of capital into LINK-related investment products. Recent data shows that Chainlink recorded approximately $935K in inflows on March 6, following $1.93 million in inflows the previous day.
This pushed the cumulative inflow figure to nearly $90.66 million, highlighting continued interest in the Chainlink ecosystem. What makes this development particularly important is that the inflows are occurring during a weak market environment, when many altcoins are experiencing capital outflows.
Sustained inflows during uncertain market conditions often indicate strategic accumulation, where investors gradually increase exposure while prices remain compressed. For Chainlink, which plays a critical role in providing decentralized oracle infrastructure, this continued capital flow reflects ongoing demand for its underlying technology.
Chainlink Price Tightens Near Key Trendline: Is $12 Level Next?
Chainlink price is currently forming a tightening consolidation pattern. The chart shows LINK trading inside a structure defined by a descending resistance trendline and a stable support zone near $8.40–$8.60.
This pattern has produced a sequence of lower highs, but buyers continue defending the lower boundary of the range. Such compression typically indicates a buildup of market pressure, where volatility gradually contracts before a larger move unfolds. LINK price remains inside this structure, the stronger the eventual breakout tends to be.
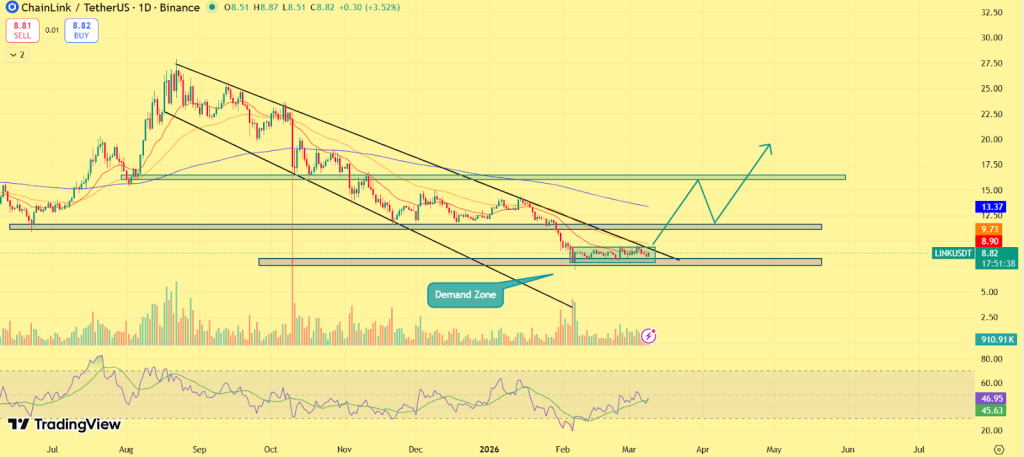
With LINK now approaching the upper boundary of the trendline, the next move could determine the short-term direction. The most important level for Chainlink price right now is the descending resistance trendline near $9.20–$9.40. A decisive breakout above this region could allow LINK to reclaim the $10 psychological level, which has previously acted as a strong supply zone. If bullish momentum accelerates, analysts are watching the $11–$12 region as the next major upside target.
This zone aligns with previous consolidation areas seen during earlier phases of the market cycle. On the downside, the $8.40–$8.60 demand zone remains the key support structure. Holding above this region keeps the current breakout setup intact, while a breakdown below it could delay the bullish scenario. For now, the structure suggests that Chainlink price is approaching an important inflection point.
Final Outlook
Chainlink continues to show resilience in a market that remains uncertain. The combination of steady capital inflows and tightening price structure suggests that LINK may be entering a key decision phase. If buyers manage to push the token above its descending resistance trendline, the current consolidation could quickly transition into a stronger rally. Until then, the ongoing compression indicates that Chainlink price may be preparing for its next major move.