Bitcoin Bulls Awaken As Rare Golden Cross Signal Flashes On Charts

Analysts believe Bitcoin may still have significant upside ahead, pointing out that a rare signal has appeared on a key valuation metric for the first time in roughly two years — and history suggests it could mark the start of a major price run.
A Critical Level In Play
At around $82,500, Bitcoin is bumping up against its 200-day moving average, a line that traders closely watch. Breaking above it could end months of downward pressure.
Failing to hold it, analysts warn, could send prices sliding back toward $50,000. The stakes are high, and the outcome of this test may shape Bitcoin’s direction for months to come.
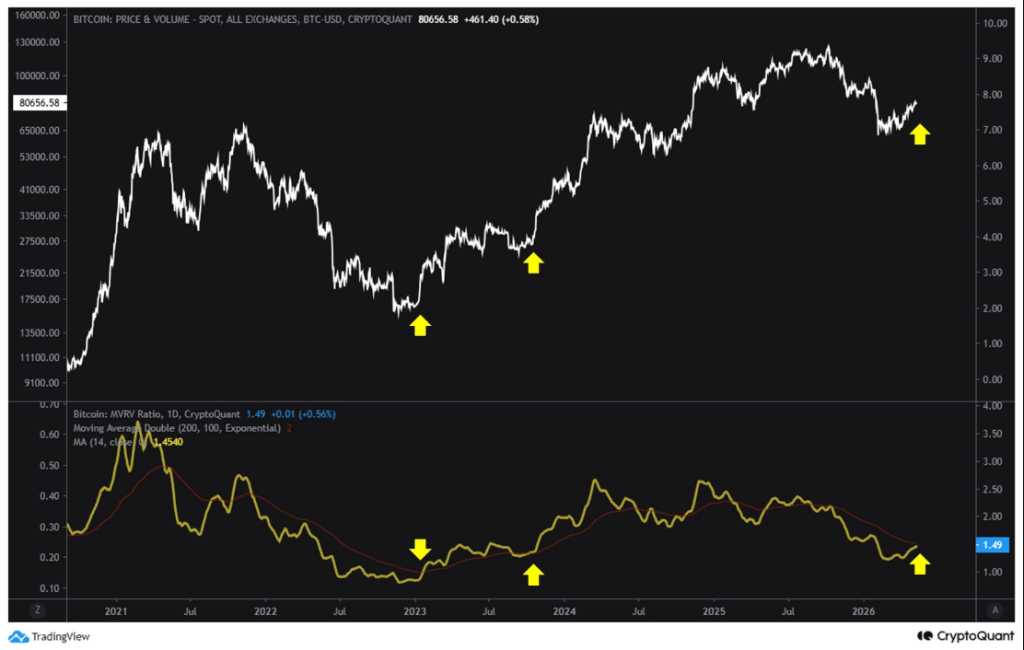
The focus, though, goes beyond simple price charts. A metric called the Market Value to Realized Value ratio — or MVRV — is on the verge of printing what analysts call a golden cross, a crossover event where the ratio moves above its 200-day exponential moving average.
CryptoQuant analyst CW8900 flagged the signal over the weekend, calling it a “representative trend reversal signal” and a bullish indicator.
A golden cross between the $BTC MVRV Ratio and the 200D EMA line is imminent.
This signal is a representative trend reversal signal and is a bullish indicator.
A golden cross is about to occur again following the dead cross last August.
Another bullish signal for $BTC is… pic.twitter.com/13z6HvNiGA
— CW (@CW8900) May 10, 2026
An earlier golden cross in late April — when the 30-day simple moving average of Bitcoin’s MVRV crossed above its 90-day equivalent — had already prompted the analyst to declare that Bitcoin had “completely turned to a bullish trend.”
What Past Signals Showed
The last time this specific MVRV crossover appeared was just after Bitcoin’s 2022 cycle low. What followed was a 90% price surge, from around $16,300 up to $31,000 in early 2023.
A second occurrence in September 2023 preceded an even bigger move — a roughly 400% rally that eventually carried Bitcoin to its all-time high of $126,000 in October 2025.
Those precedents are fueling optimism. Data from Glassnode adds another layer to the picture. The short-term holder cost basis — the average entry price for investors who have held Bitcoin for fewer than 155 days — shows a “heated” band at $92,000 and an “overheated” band at $104,000.
Based on that data, Bitcoin has room to run before reaching historically stretched territory.
Analysts Signal A Bigger Move Ahead
Multiple analysts are pointing to broader technical setups as well. Analyst Shib Spain noted that Bitcoin recently broke above a multi-month downtrend line on the weekly chart, a move reinforced by a bullish MACD crossover.
“Bitcoin’s huge breakout is coming,” the analyst posted on X. Another analyst, known as Moustache, cited the Bitcoin market cap and its Relative Strength Index bouncing off multi-year support levels on the monthly chart.
“Prices will go much, much higher,” the analyst wrote, adding that “something big” lies ahead.
Featured image from Gemini, chart from TradingView