XLM Price Analysis: Stellar Optimism Inspires Run for the 4th Day in a Row
Stellar (XLM) upside run returns after hitting lows of $0.4535 on Apr. 7 as buyers embrace rebound and lifted price above earlier restrictions to $0.6562 yearly high.
*XLM/USD sustains upside run for the 4th day in a row
*Stellar (XLM) strives to consolidate latest gains after Apr. 7 plunge
*Stellar (XLM) exceptionally high funding rates worrisome
After having established a solid support base at $0.4535, the price has rallied back towards a yearly high at $0.6562. A bullish breakout past the yearly high could lead to a sharp spike as a result of triggering stop-losses and momentum buying. The pair stands beneath the recent yearly high in early Tuesday’s trading, but near-term action sustains an upside run for the 4th day in a row. After the pullback from the new one-year high at $0.6562, XLM found footstep at $0.4535 on Apr. 7, Stellar (XLM) strives to consolidate gains and it’s reinforced by rising moving average (MA 50) that eased downside pressure and keeps in play hopes of fresh advance while the price remains above this level.

Stellar Funding Rates Overextended
Long and short traders will pay funding rates regularly depending on the disparity between the perpetual contract market and the spot market. Long traders would compensate short traders if the funding rate is positive, and inversely. At 0.25 percent on Binance and as high as 0.29 percent on Huobi, the existing XLM funding rates are highly overextended. Funding rates of 0.1 percent or higher, according to some analysts, are important. According to Viewbase metrics, Stellar’s rates are higher than 0.1 percent on Binance, FTX, Huobi, and Okex.
XLM Daily Chart: Bullish

In the near term, the XLM/USD is expected to test the overhead resistance of the weekly high at $0.6562. The lift above the yearly high is needed to signal a higher low ($0.5766) and open way for further rise, while later continuing with extended sideways mode but with existing downside risk, which could be expected while towards the moving average (MA 50).
On the other side, XLM bearish scenario sees possibilities of a deeper correction of the four consecutive day’s run of $0.4817/$0.6562 rally on a firm break of $0.5469 support and a higher low of Apr. 7 at $0.4535. In the case of the price surging above the $0.6562 level, the pair could encounter resistance at the upper horizontal line at $0.7000 and the $0.7500 mark.
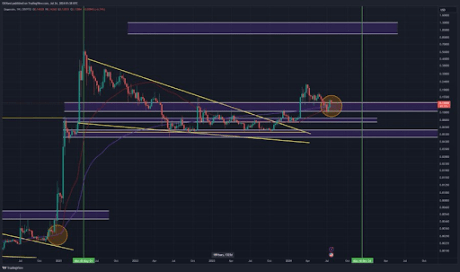
XLM/USD 4-Hour Chart: Ranging

XLM/USD retreated to the immediate horizontal support line at $ 0.6050 after easing below formed resistance near $0.6562, which crossed with the upper wick of the yearly high candlestick. The rising moving average (MA 50) protects the positive pattern. Despite a slight pause in the falling trajectory of the uptrend, the rising sentiment of the XLM has not yet reflected any clear opposite shift towards positive price movement.
However, short-term oscillators convey mixed directional momentum signals and thus contribute to an unclear near-term outlook. The 4-hour moving average of 50 and 200 remains below the price and moves more and more towards the middle of the chart above the sell threshold, while the RSI tries to hold higher in bullish territory.
Key Levels
Resistance Levels: $0.7500, $0.7000, $0.6562
Support Levels: $0.6050, $0.5666, $0.5469
Image Credit: Tradingview
Note: coinpedia.org is not a financial advisor. Do your research before investing your funds in any financial asset or presented product or event.