Four Indicators Hints Bitcoin Price Still In the Bull Run
Popular New Zealand-based crypto analyst and influencer Lark Davis (@TheCryptoLark on Twitter) says that Despite the recent correction, a number of indicators indicate that the end of the Bitcoin rally is still a long way off.

In a recent video, Davis names four well-known indicators to reveal that the world’s largest crypto asset by market cap is still in the game.
The Bitcoin Heat Map, which uses colours to reflect the percentage increase of the 200-week moving average (MA) on a month-to-month basis, is the first indicator that the trader brings up. It’s thought that the spots turning red, which they haven’t done yet, indicate an overheated market.
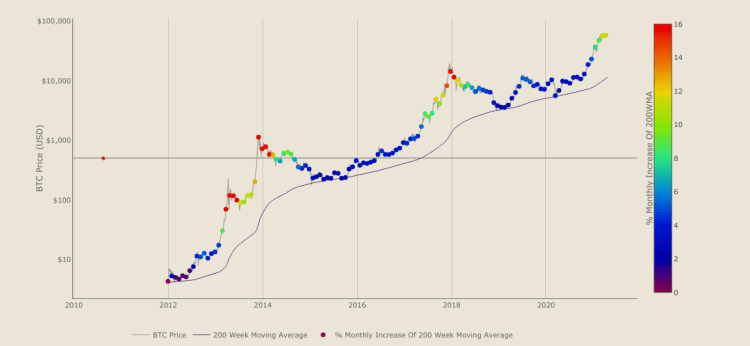
He says that there are currently no red dots available. Also there are no orange dots right now.The cryptocurrency markets may still be 4, 5, or 6 months away from a true blowoff top. Here we are just looking at Bitcoin, but Bitcoin does lead the markets, so if Bitcoin rises to, say, $150,000 or $250,000 during this market period, we’ll see our red dot appear. And also he mentions that it’s just a perspective.
The Puell Multiple, which examines Bitcoin miners’ income in relation to the price of BTC, is the next metric Davis mentions. Owing to their need to pay fixed costs, miners are considered to be compulsory sellers. According to Davis, this measure has not yet reached the overbought zone.
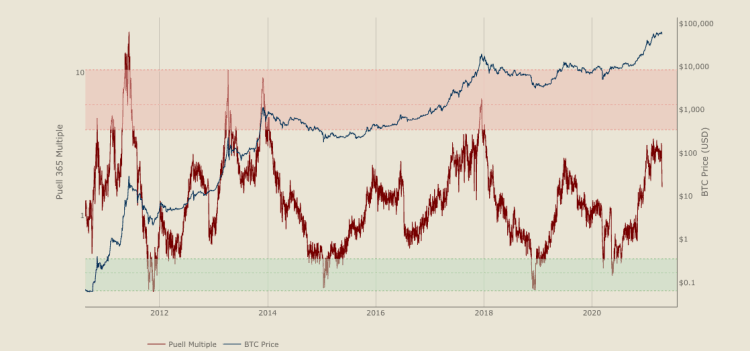
He went on to say that this does not indicate that a market blowoff top is taking place right now. It is probably something like the 2017 bull market which began in July, August, or September. For the sake of reference, that’s where we could be right now, given the large dips and corrections we’re seeing. We haven’t yet entered this area (red rectangle) that indicates we have a problem.
Davis also examines the 2-year MA multiplier, a long-term based metric that employs a two-year moving average and a fifth-year moving average.
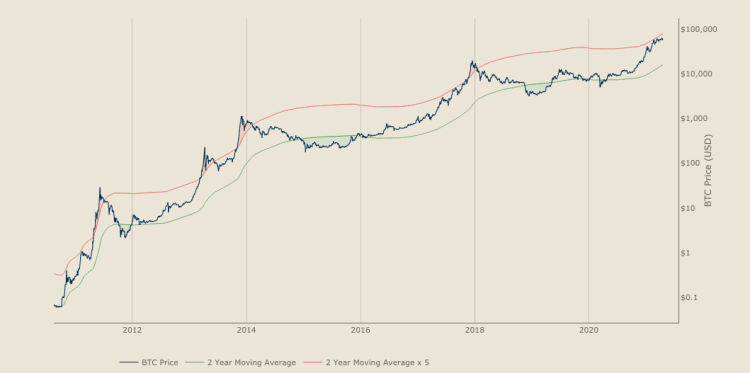
Each time a Bitcoin bull rally ended, BTC first shot up past the red line, according to the famous YouTuber. According to Davis, Bitcoin’s current price behaviour parallels that of mid-2017, when it first started to nudge the red line for months before rocketing upward for a final blowoff.
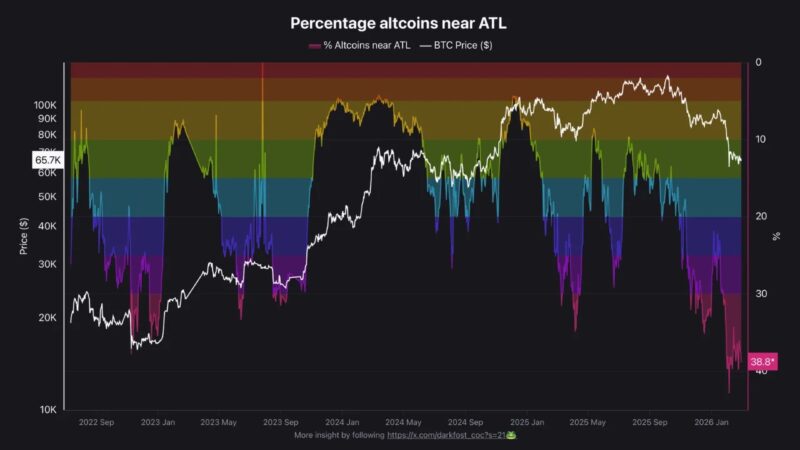
Furthermore, the analyst points out that the Bitcoin Rainbow price map, which uses a logarithmic growth scale, indicates that BTC has just recently passed the halfway point and has a long way to go before losing momentum.
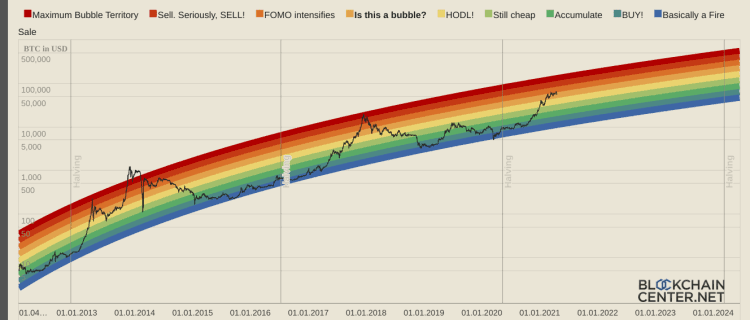
You can see in the previous market cycles we did get up to the ‘Is this a bubble?’ territory or even above in some situations. 2017 hit it very very nicely heading up to around $20,000. We are not there yet.”
Davis believes the bull market hasn’t reached its apex, based on the four metrics.
People out there packing saying that the top is in.. They’re not actually looking at the bigger picture here, looking at the indicators. understanding what’s going on. Look, I could be wrong about anything and everything that I say… But I look at the indicators, I look at the sentiment in the market and all these different things, and I don’t feel like this is the top of the bull run.”