BTC, ETH and TRX Price Analysis for April 24


Can the coins from the top 10 list bounce off after a sharp drop?
The market continues under a bearish influence as most of the coins are located in the green zone.
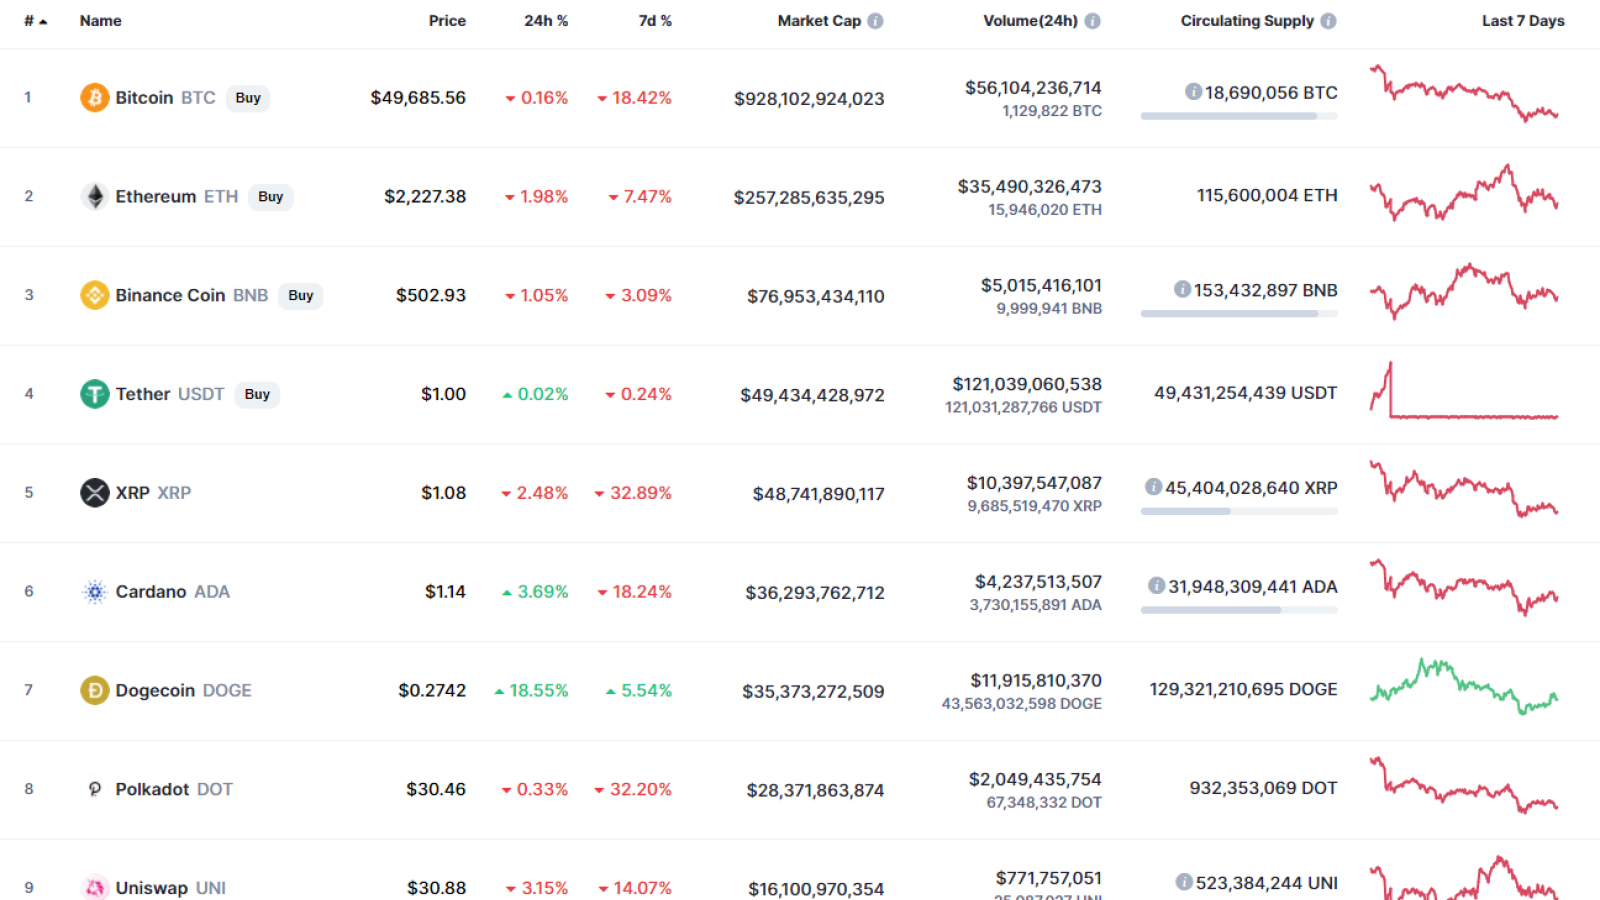
The crucial data for Bitcoin (BTC), Ethereum (ETH) and TRX:
|
Name |
Ticker |
Market Cap |
Price |
Volume (24h) |
Change (24h) |
|
Bitcoin |
BTC |
$928,102,924,023 | $49,593.18 | $56,104,236,714 | -0.47% |
|
Ethereum |
ETH |
$257,285,635,295 | $2,223.81 | $35,490,326,473 | -2.48% |
|
TRX |
TRX |
$7,736,620,764 | $0.1083 | $4,322,828,462 | 5.61% |
BTC/USD
Bitcoin (BTC) could not fix above the $50,000 mark, going down by 0.47% over the last day.
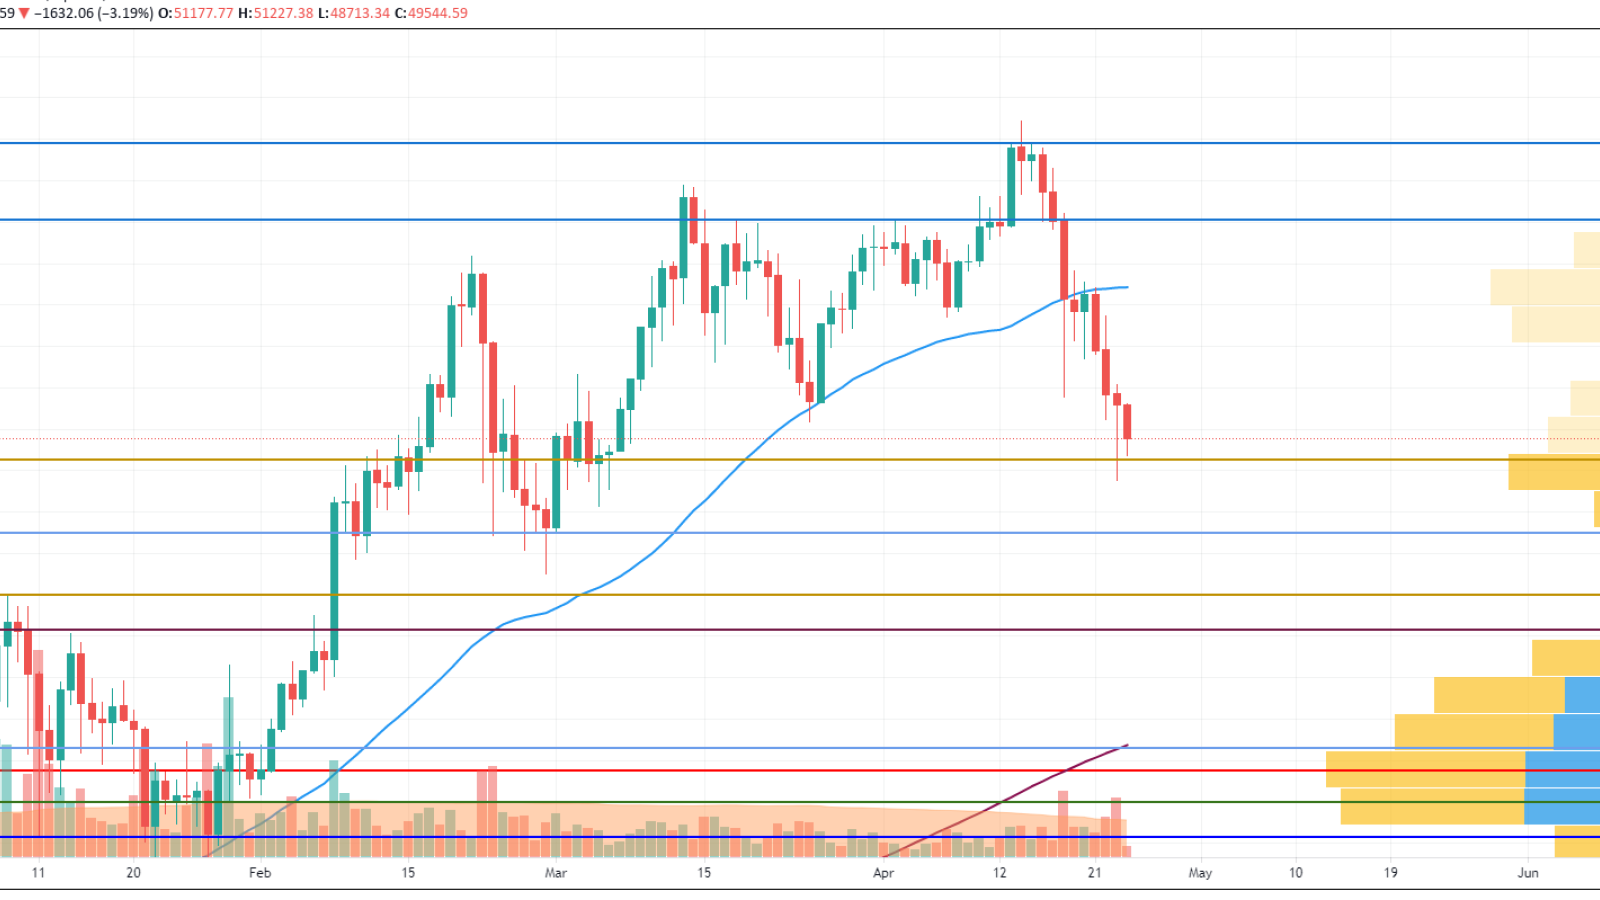
Analyzing the daily chart, bulls are weak at the level of $48,500, which means that the decline might continue.
In this case, there are high chances of seeing a test of another vital support at $45,000 soon.
Bitcoin is trading at $49,600 at press time.
ETH/USD
Ethereum (ETH) is the biggest loser today as the rate of the main altcoin has decreased by 2.48%.
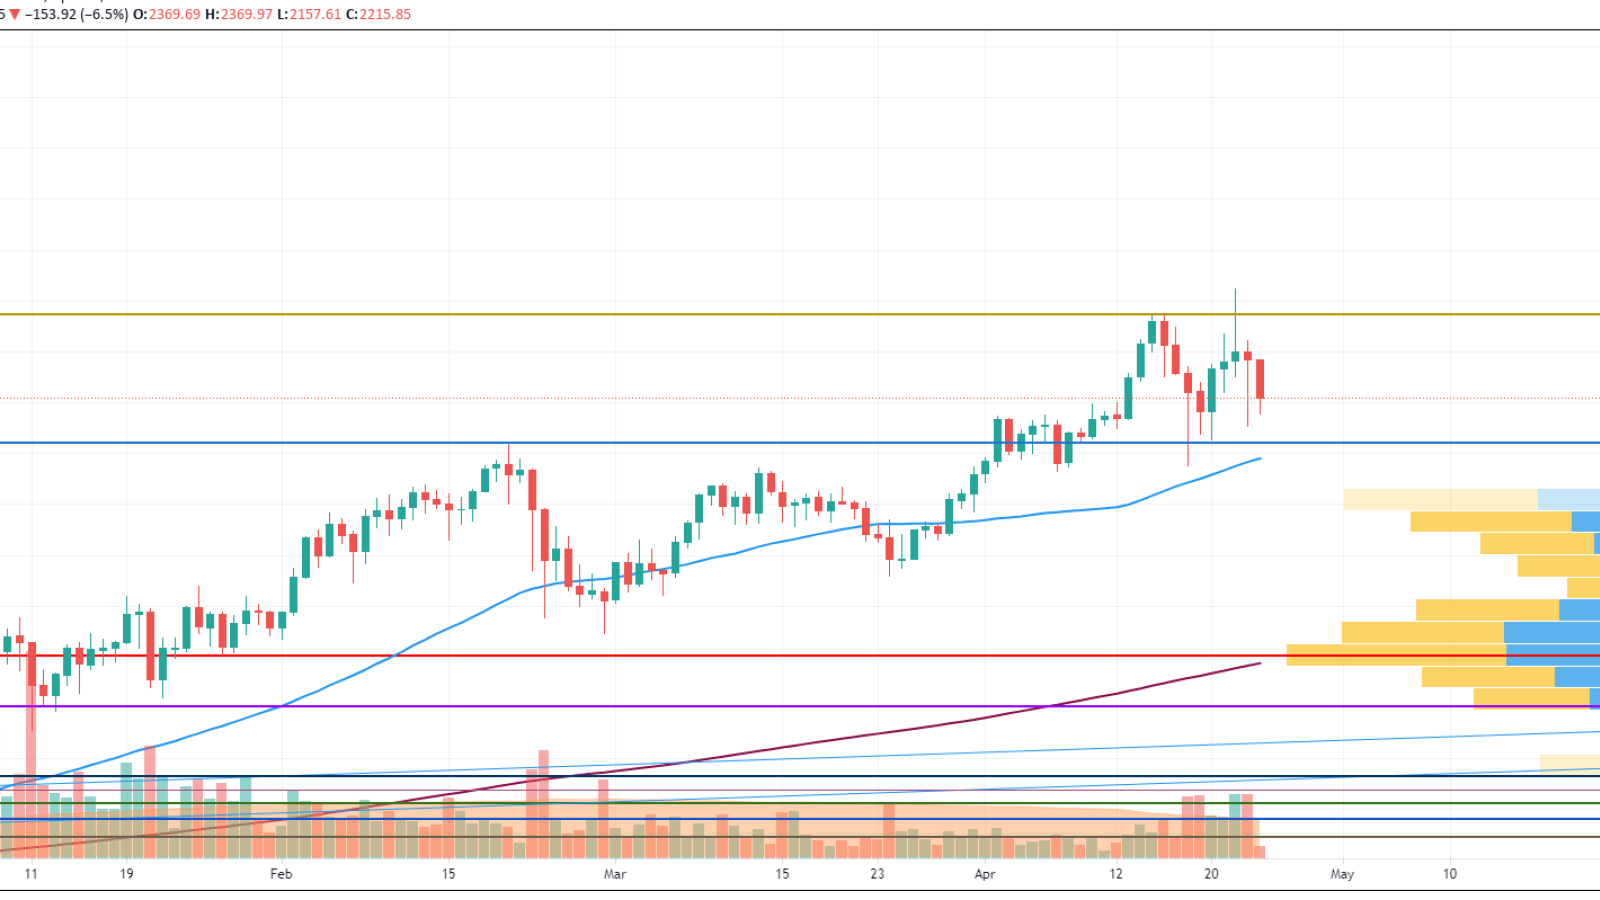
Ethereum (ETH) is about the follow the drop of Bitcoin (BTC). Even though the selling trading volume is low, traders might see ETH trading around the level of the MA 50, around $1,980, at press time.
TRX/USD
TRX is the only coin from our list trading in the green zone. It has grown 5.61% since yesterday.
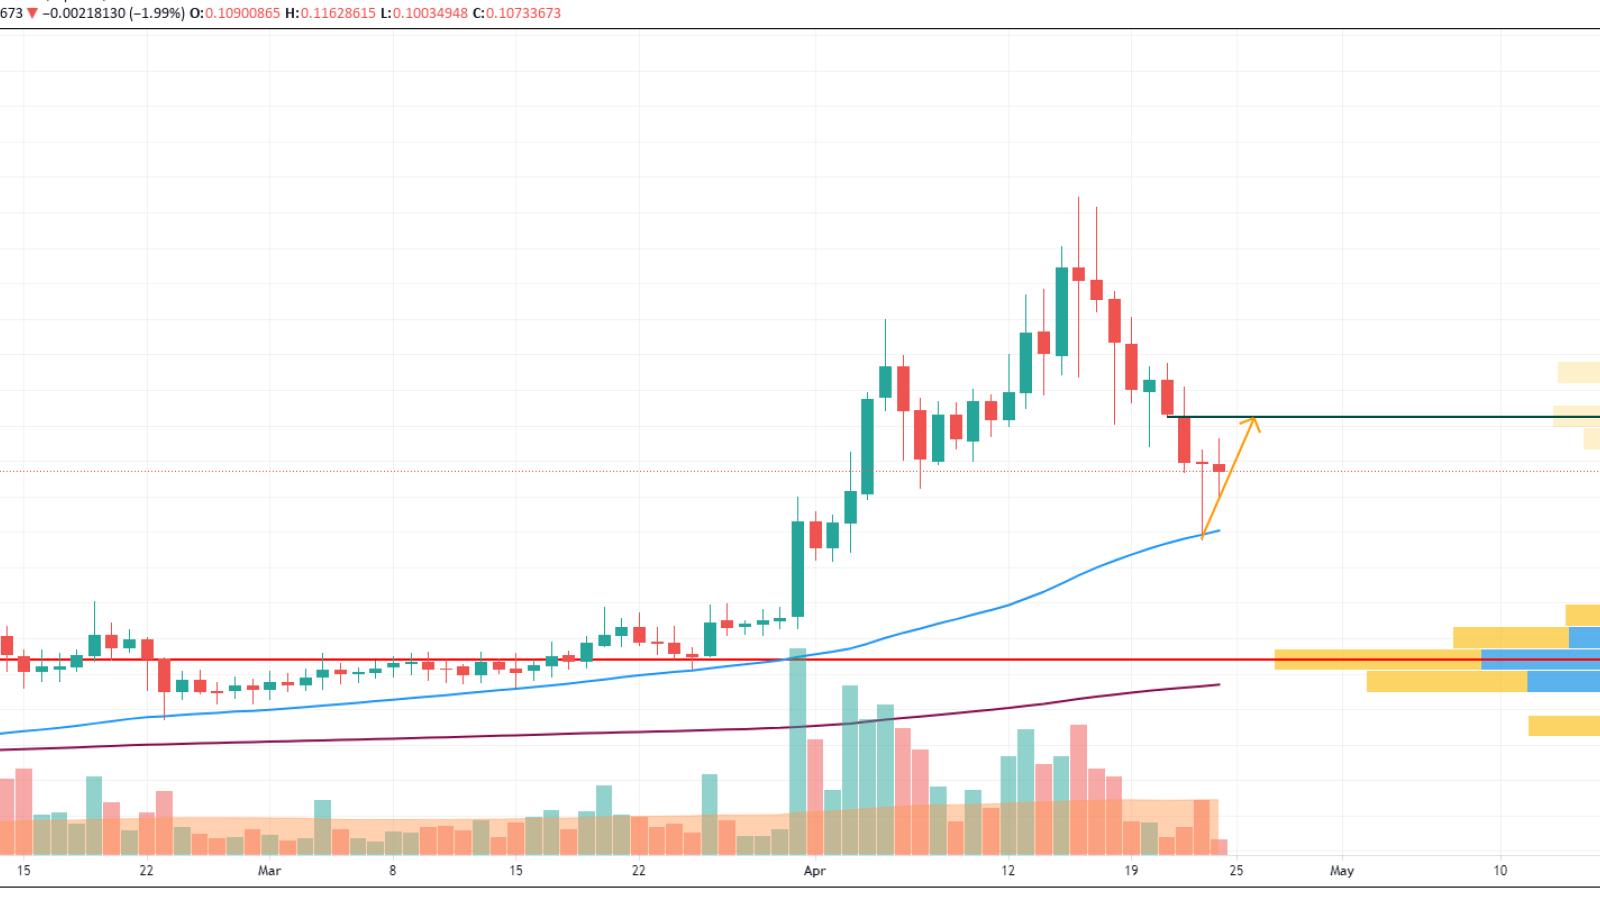
From the technical point of view, TRX has successfully bounced off the MA 50 on the daily chart, having confirmed the bulls’ power. As the more likely scenario, the coin might test the firmed mirror level where most of the liquidity is focused. The zone is located at the mark of $0.12.
TRX is trading at $0.1069 at press time.

