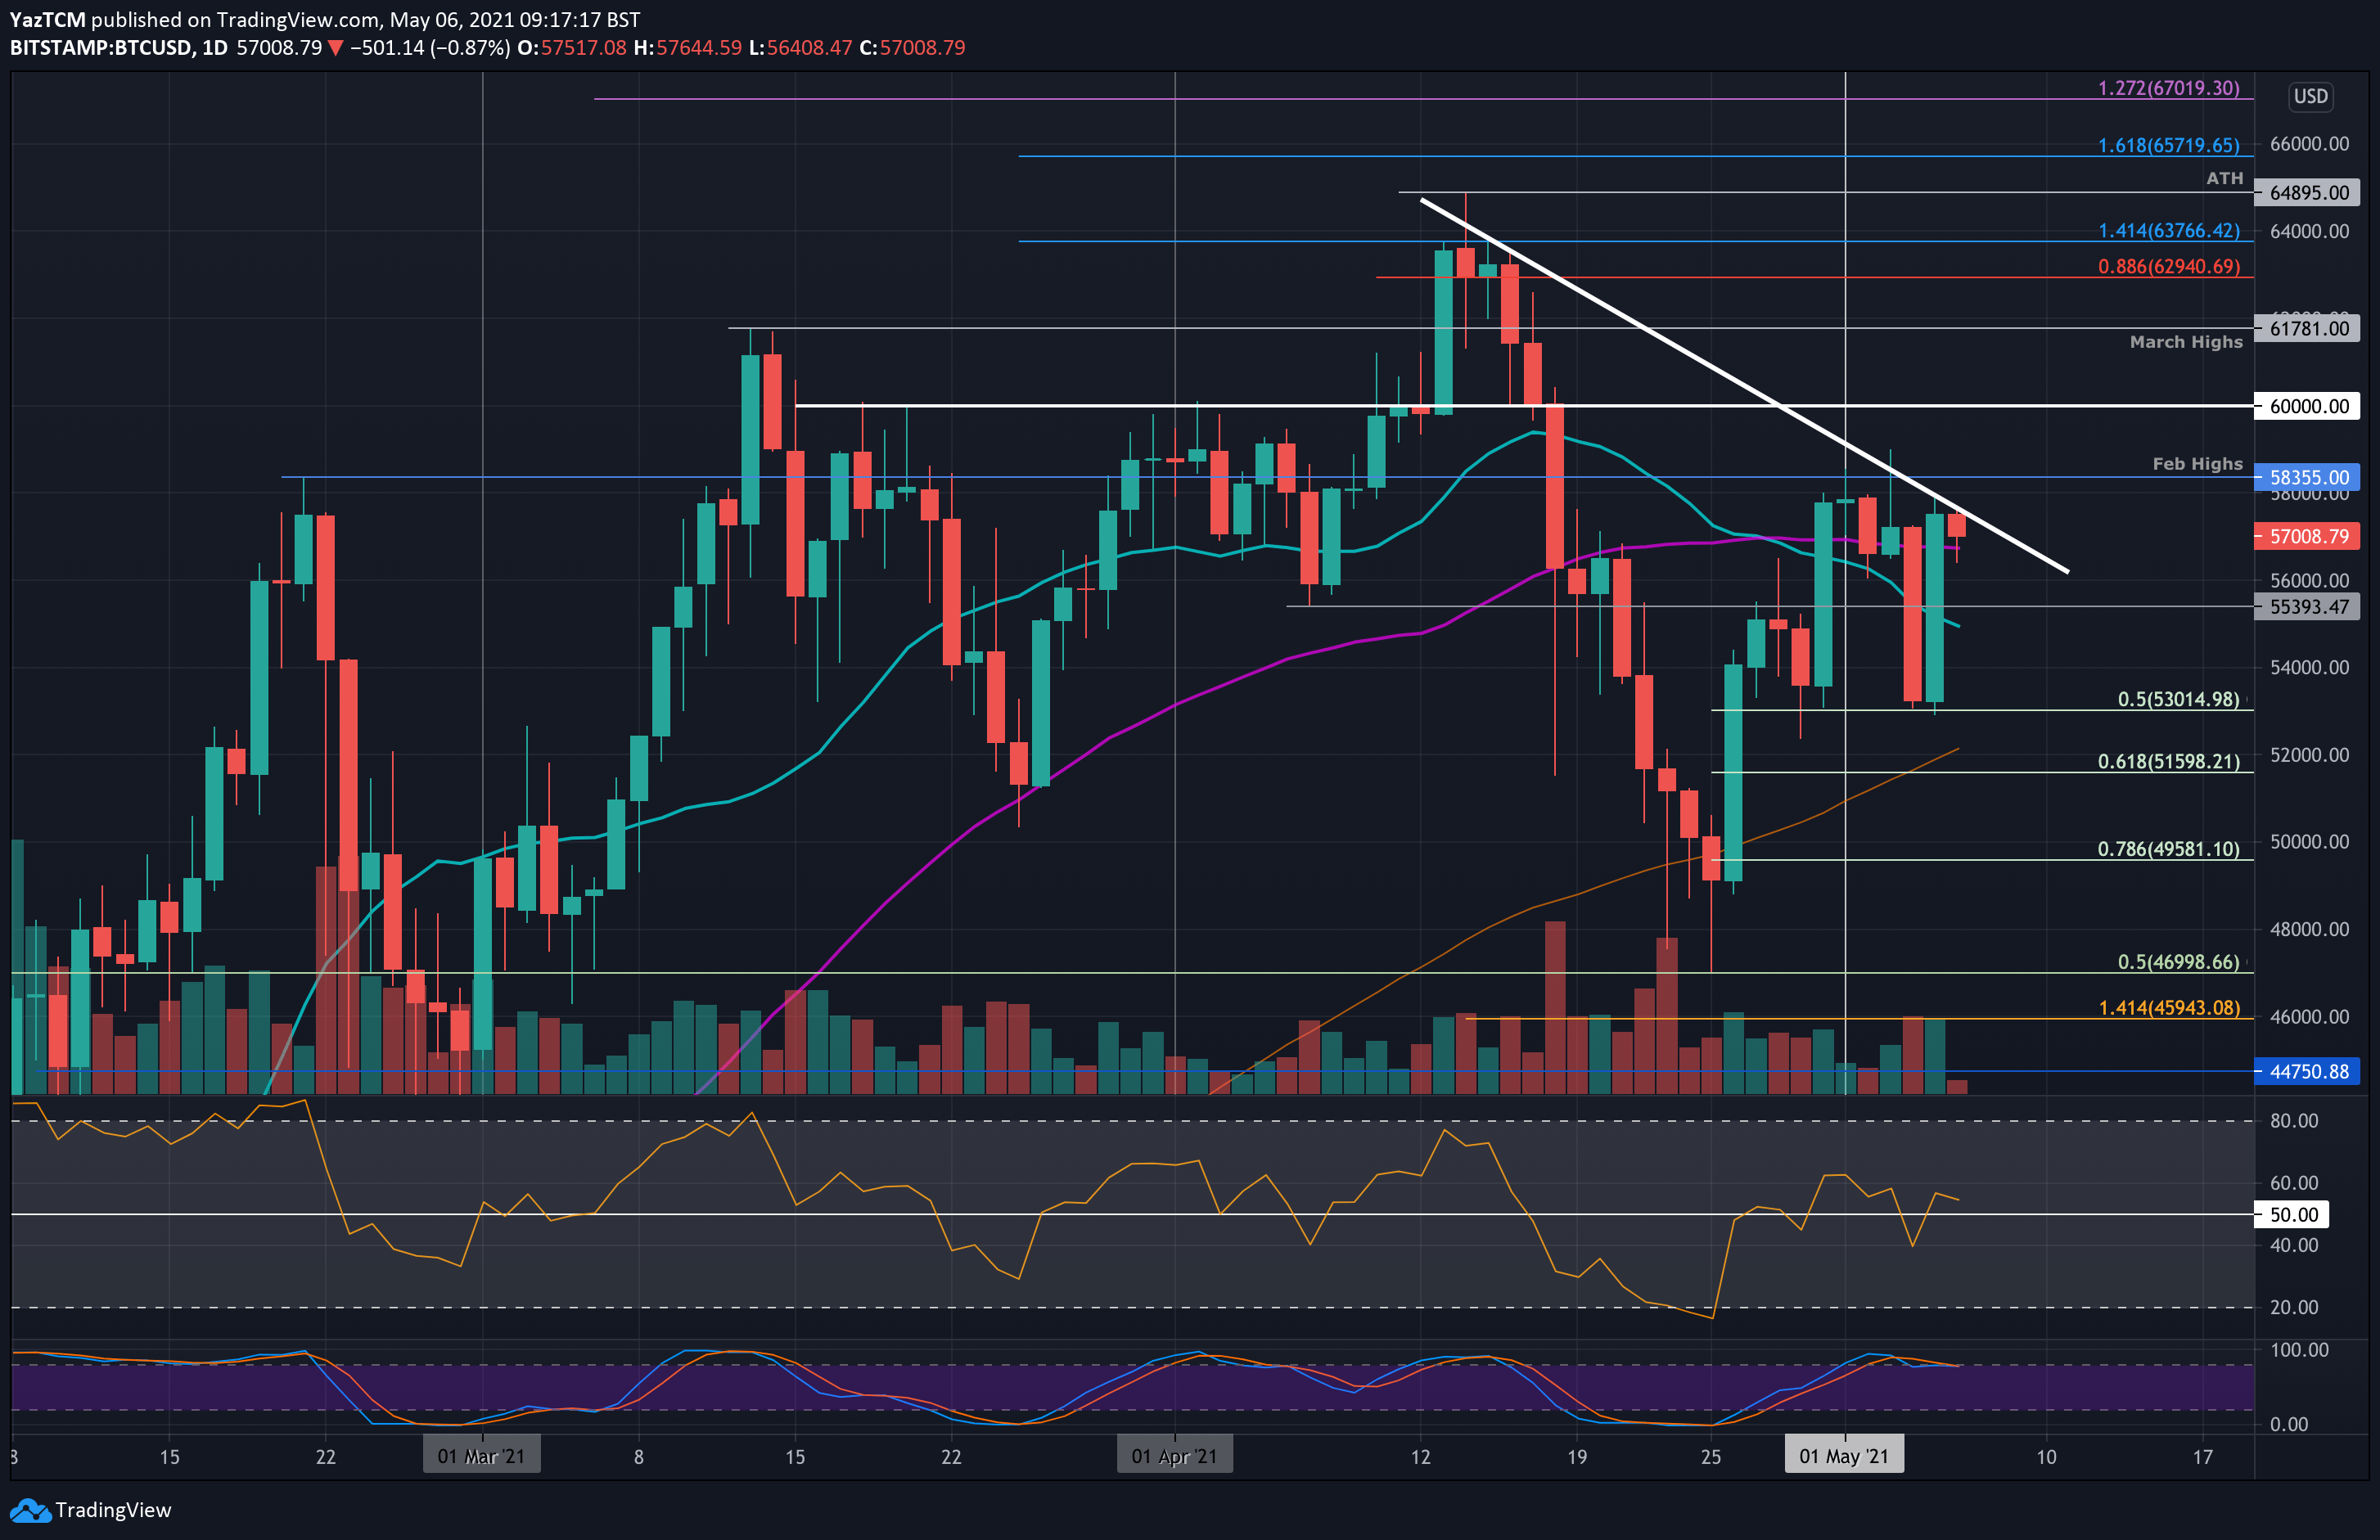
Bitcoin Price Analysis: BTC’s Sideways Action to Finally End With a Breakout Above $60K?
Bitcoin is up by a robust 4% today as it bounced from $53,000 to reach as high as $58,000 yesterday. It has since dropped slightly and is trading around $57,000.
Amazingly, over the past 2.5 months, bitcoin’s trading range is mainly between $50k and $60k. Yesterday’s high at $58k, together with the fact that BTC was unable to close a daily candle above it since mid-April, makes this the first major barrier for the primary cryptocurrency.
On Tuesday, bitcoin saw a sharp 7% price drop as it fell from $57,200 to reach as low as $53,000. It found support at a short-term .5 Fib Retracement, which allowed it to rebound to get as high as $58,000 yesterday.
The push toward $58,000 allowed bitcoin to break back above resistance at both the 20-days and reach the critical level where lies the 50-day moving average line. Over the past days, bitcoin was unable to get away from the MA-50 zone, which currently lies around the $56.8k area.
In addition to the above, bitcoin’s price also encountered resistance at a descending trend line that dates back to April’s all-time high levels and could not push above it. BTC must break this trend line if it would like to trade beyond $60,000 during May.
BTC Price Support and Resistance Levels to Watch
Key Support Levels: $56,750, $55,400, $54,950, $53,000, $52,000.
Key Resistance Levels: $58,000, $58,355, $60,000, $61,780, $62,940.
Looking ahead, the first support lies at $56,750 (50-days MA). This is followed by $55,400, $54,950 (20-day MA), $53,000 (.5 Fib), and $52,000 (100-day MA).
On the other side, the first resistance above the descending trend line lies at $58,000. This is closely followed by $58,355 (Feb 2021 Highs), $60,000, $61,780 (March 2021 Highs), and $62,940 (bearish .886 Fib Retracement).
The RSI is above the midline but is showing weak bullish momentum. To break back above $58,000, the RSI must start rising and make higher highs above 60 to indicate increasing bullish momentum in the market.
Bitstamp BTC/USD Daily Chart
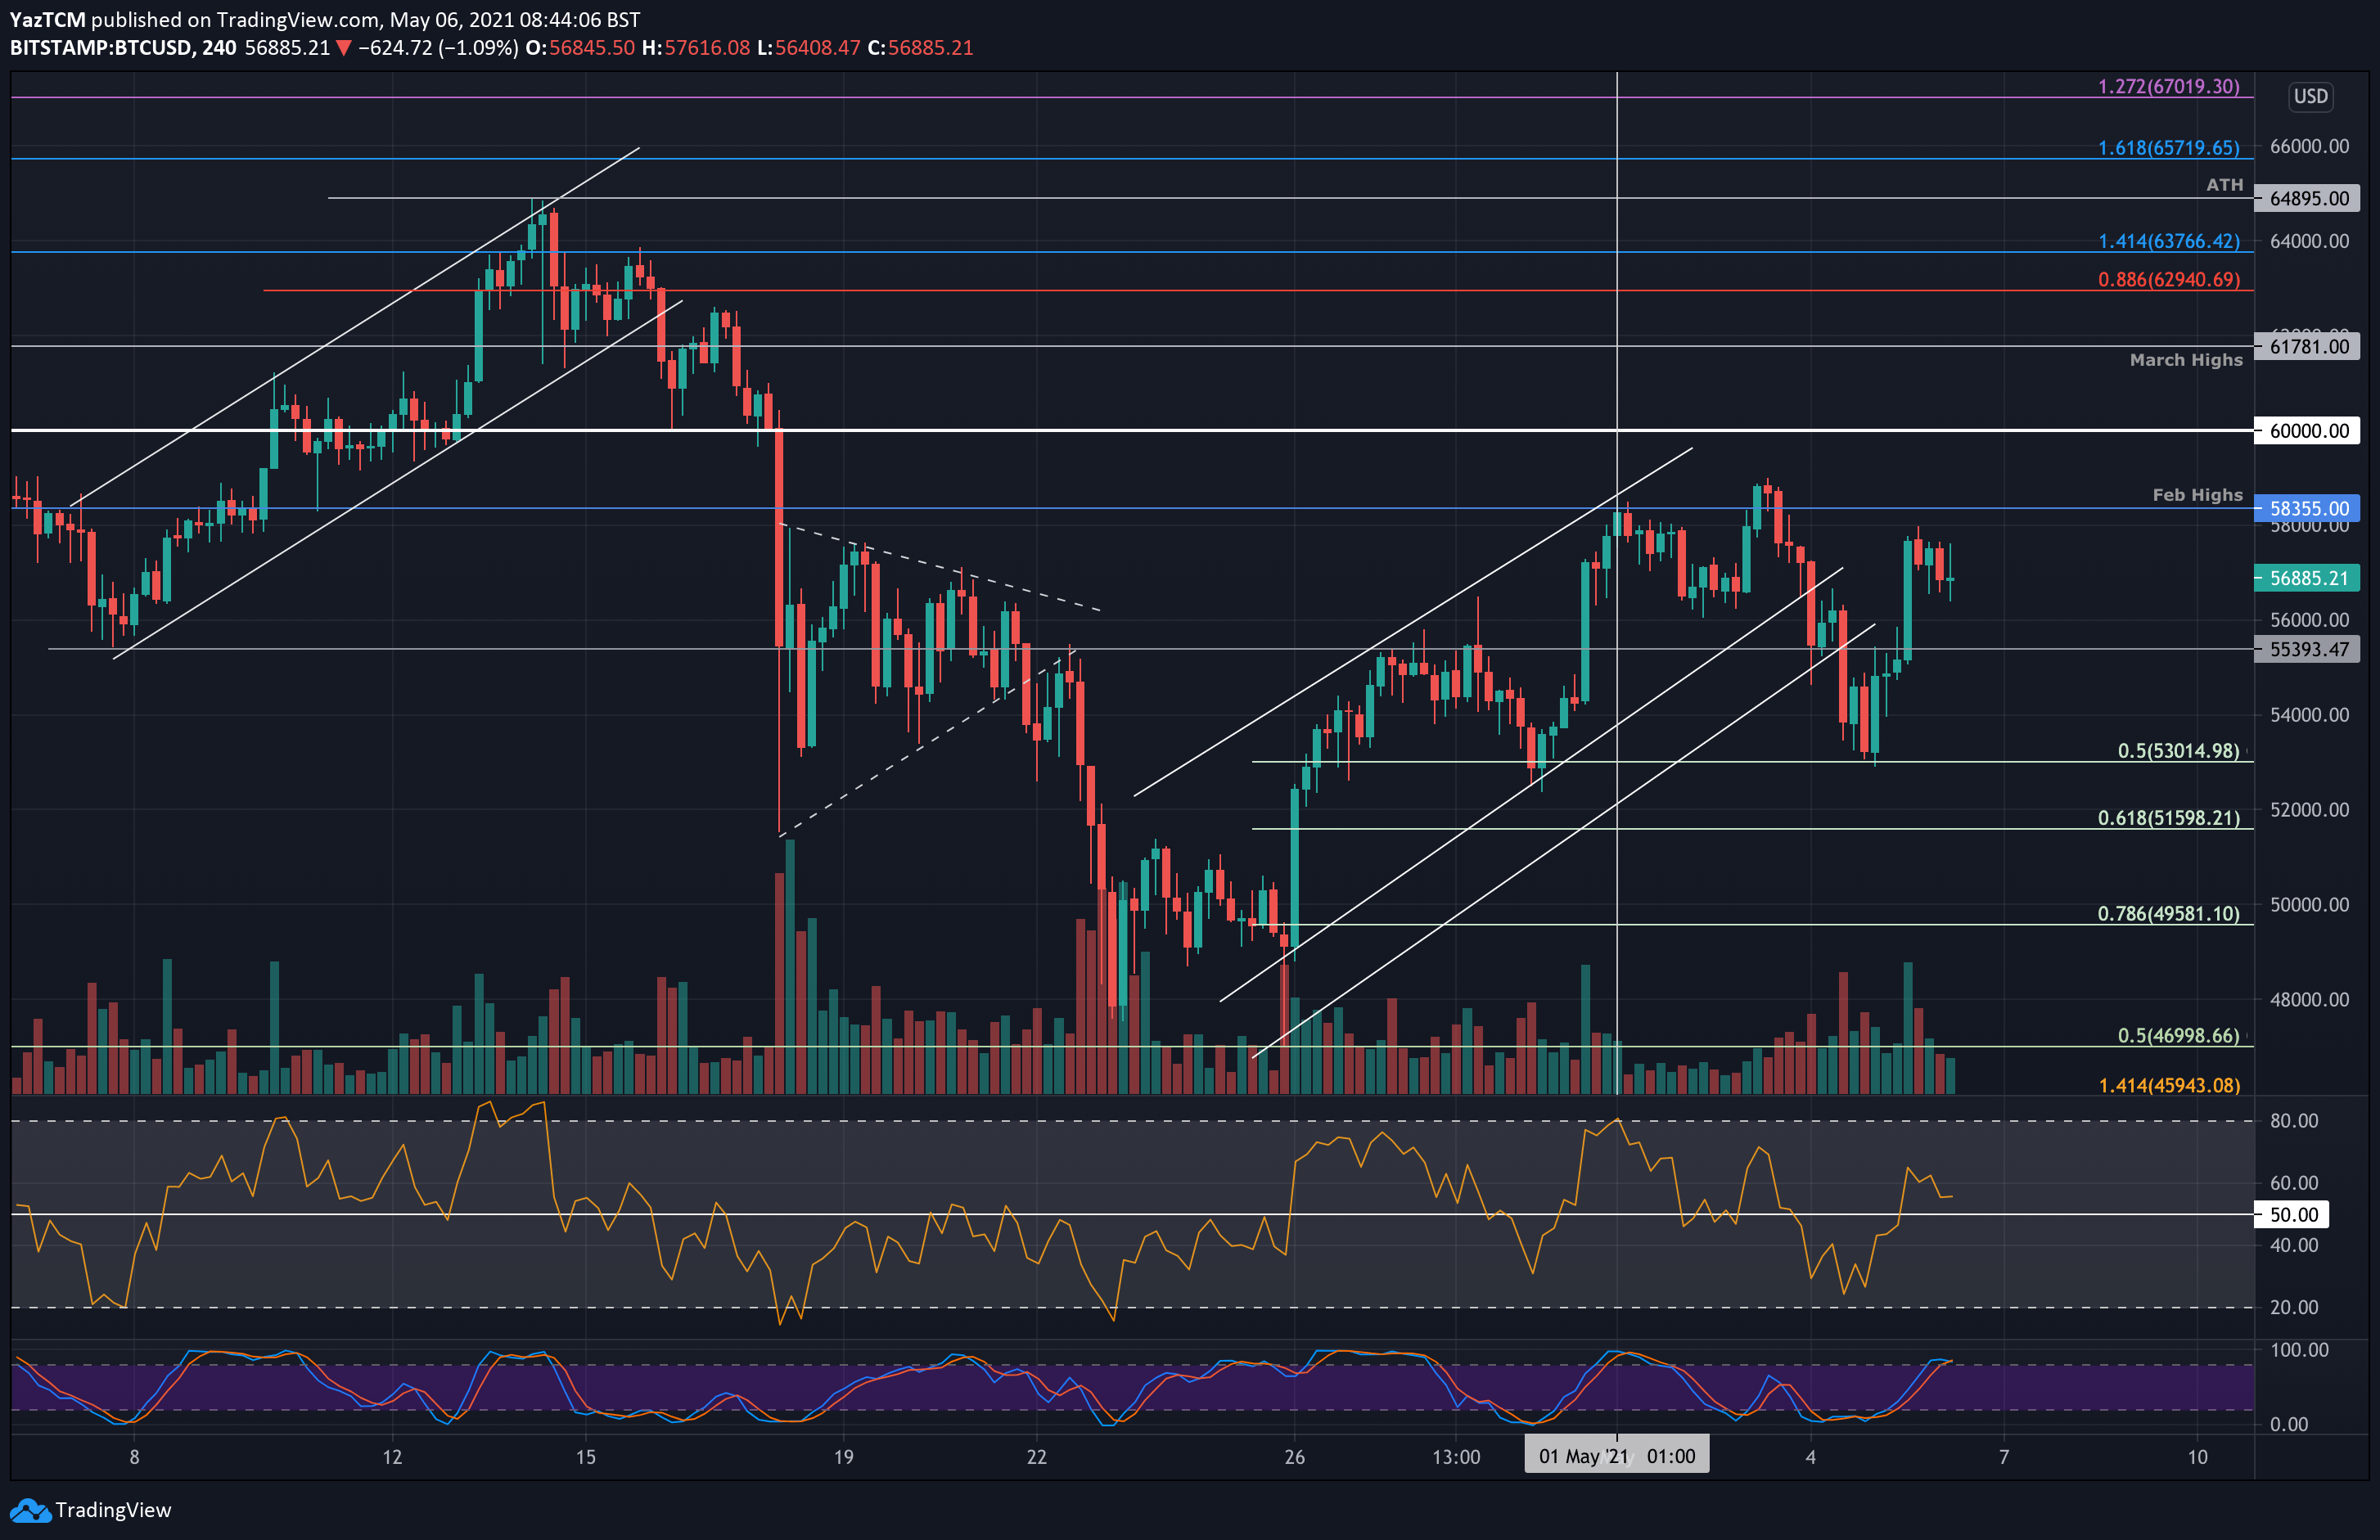
Bitstamp BTC/USD 4-Hour Chart
Binance Futures 50 USDT FREE Voucher: Use this link to register & get 10% off fees and 50 USDT when trading 500 USDT (limited offer).
PrimeXBT Special Offer: Use this link to register & enter POTATO50 code to get 50% free bonus on any deposit up to 1 BTC.
Disclaimer: Information found on CryptoPotato is those of writers quoted. It does not represent the opinions of CryptoPotato on whether to buy, sell, or hold any investments. You are advised to conduct your own research before making any investment decisions. Use provided information at your own risk. See Disclaimer for more information.
Cryptocurrency charts by TradingView.