Ethereum Price Analysis: ETH up 100% in a Month, Paints Fresh ATH

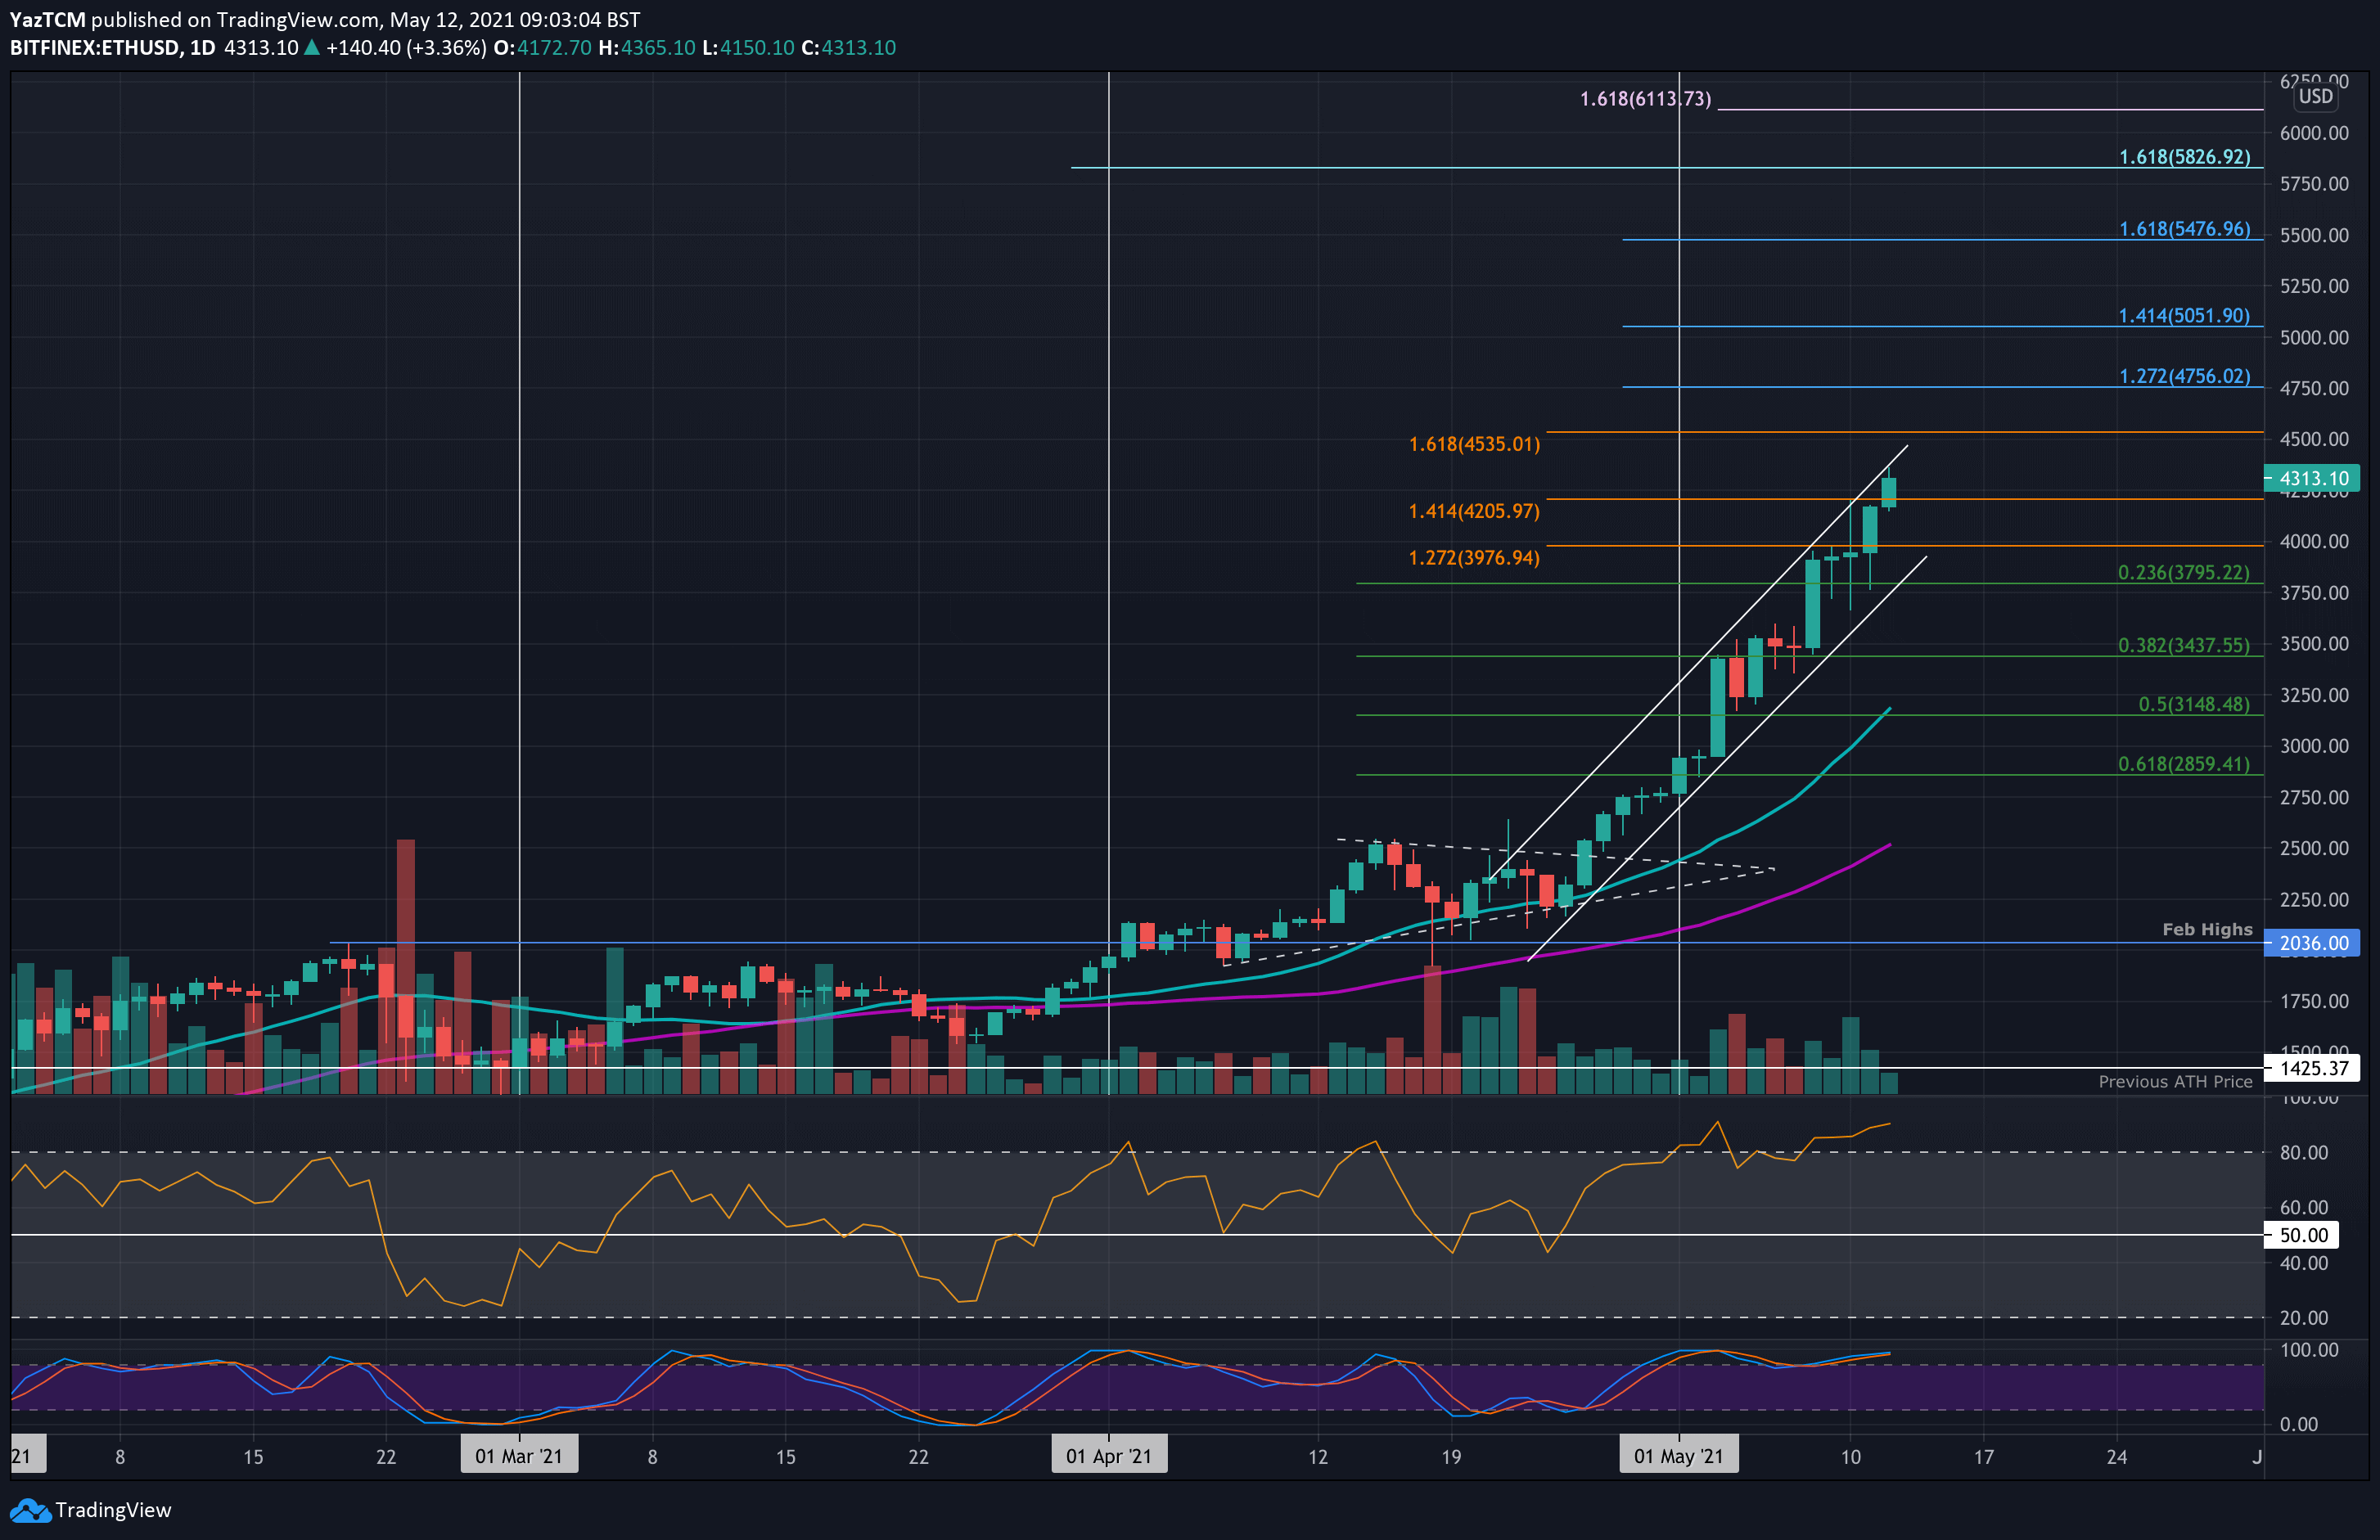
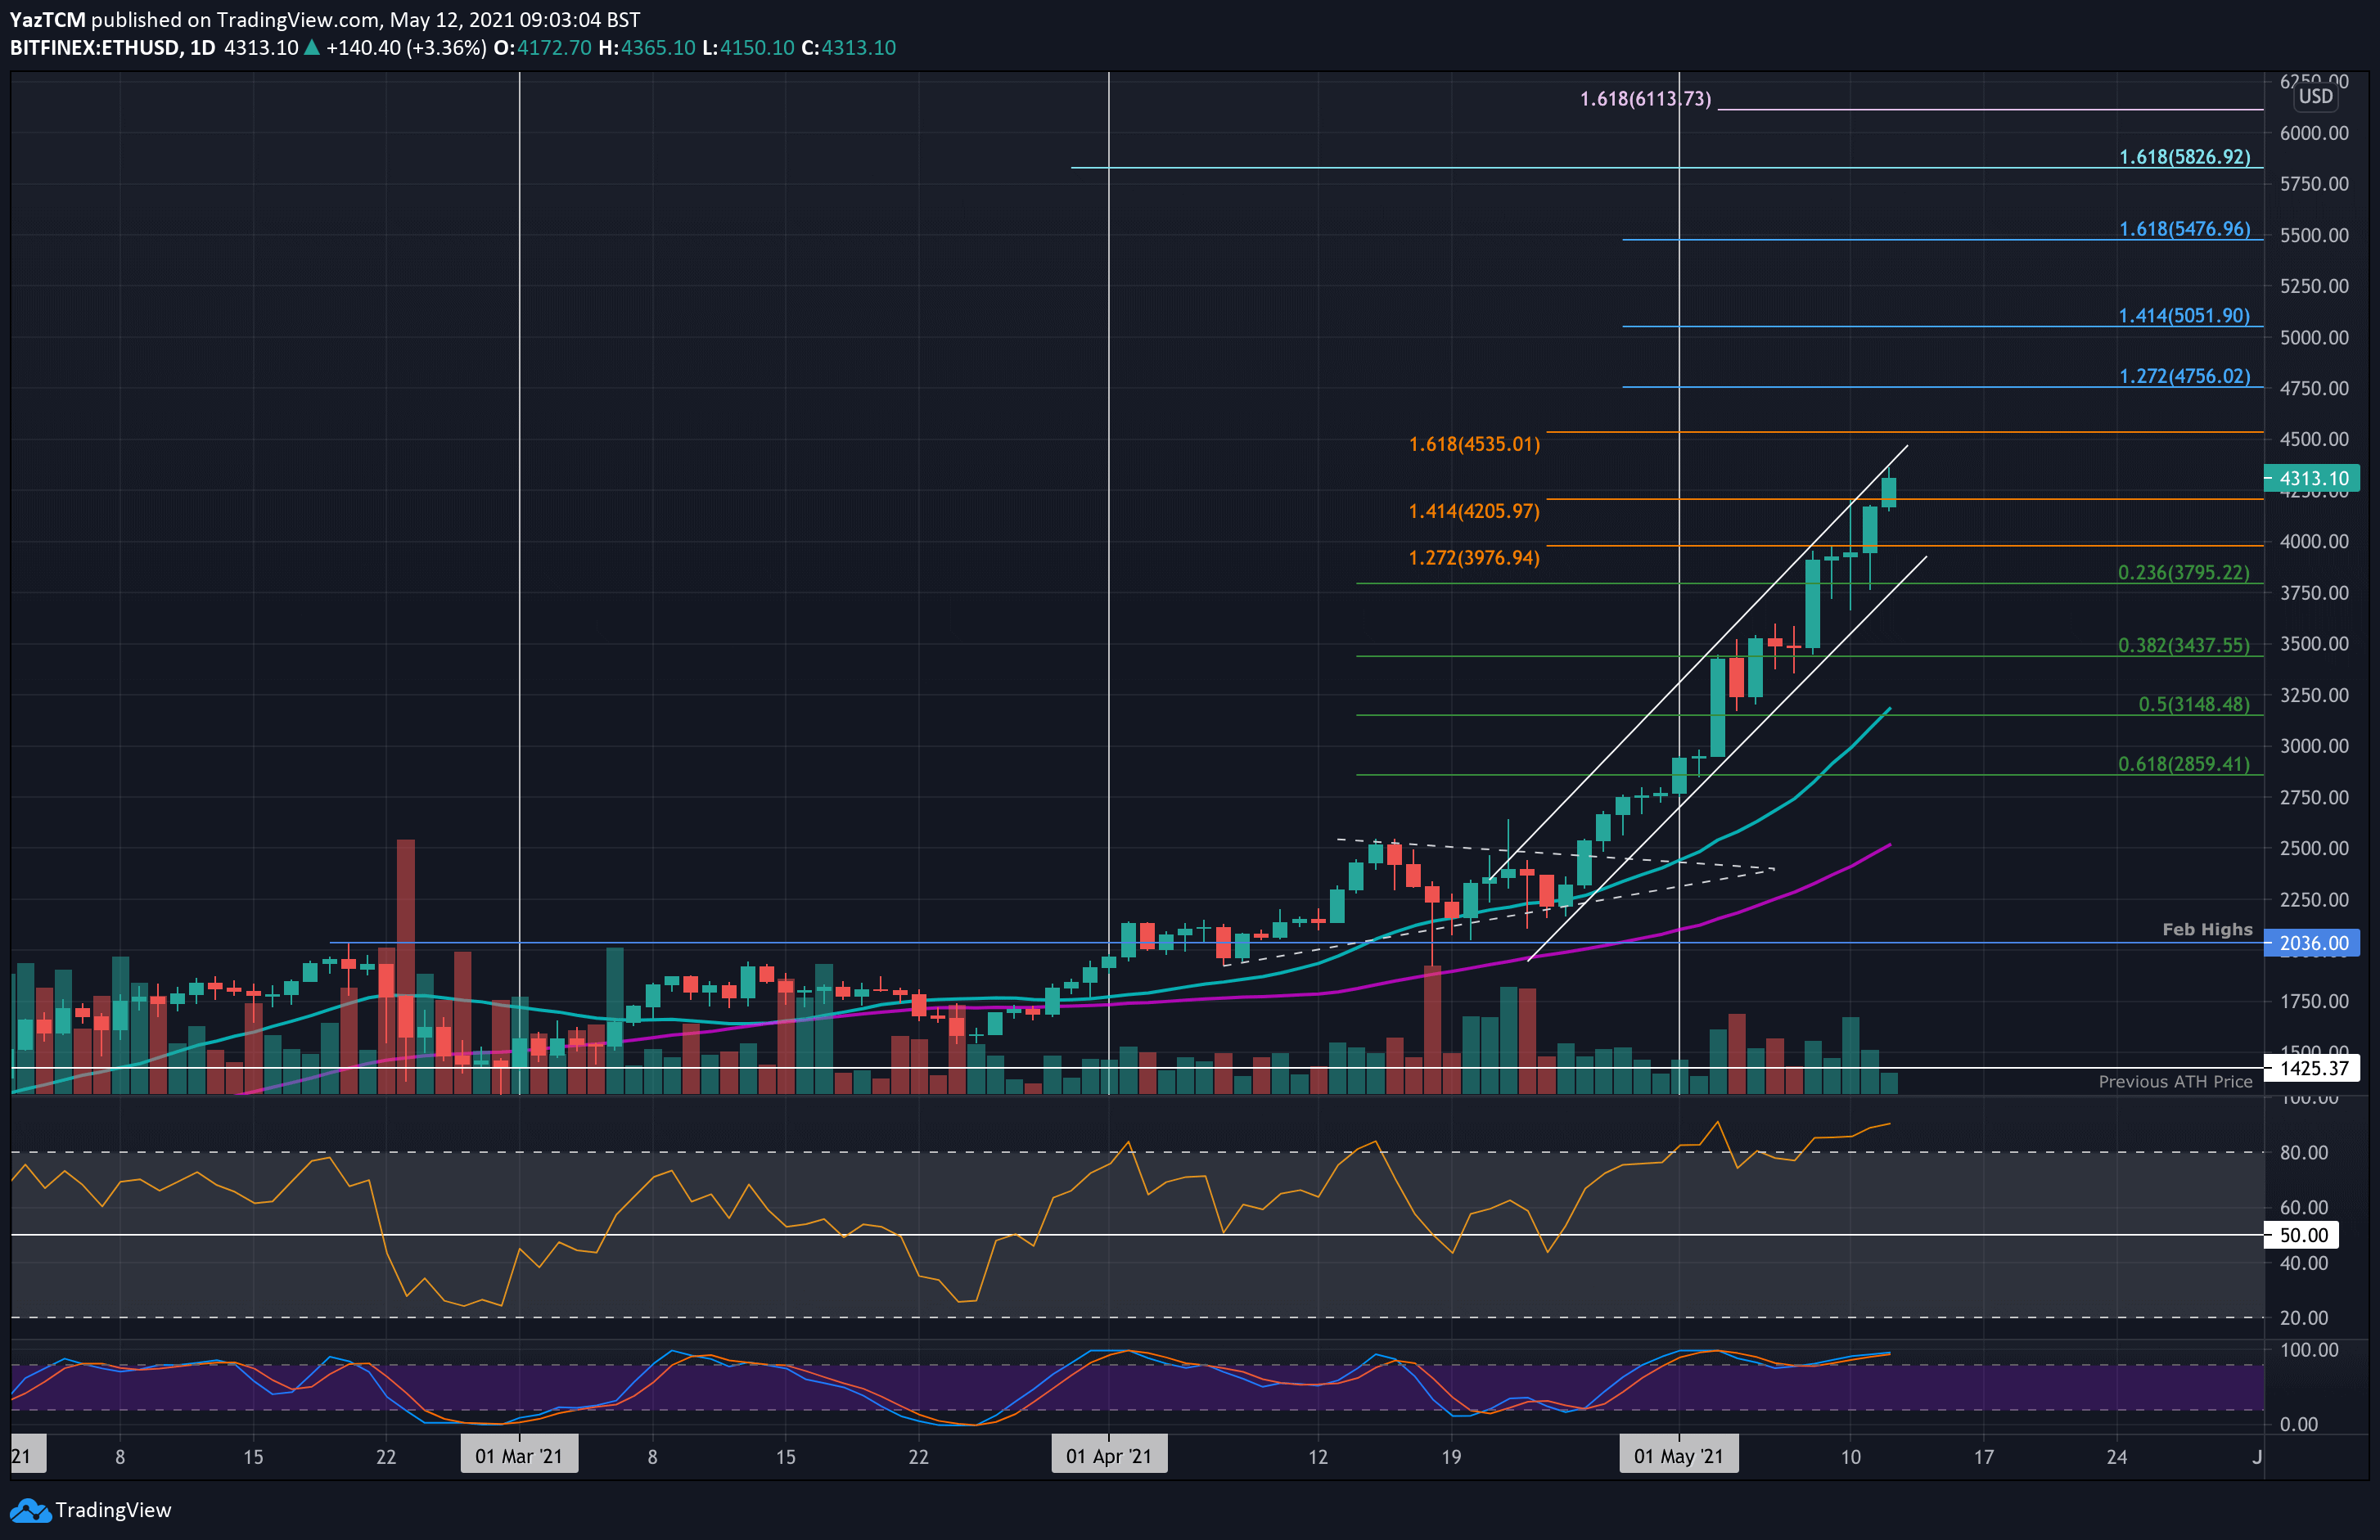
ETH/USD – Ether continues to set new ATHs above $4,300.
Key Support Levels: $4200, $4000, $3795.
Key Resistance Levels: $4365, $4553, $4756.
Ethereum is continuing its amazing run as it produces a 99% price hike over the past 30-days of trading. The coin had surged beyond $3500 on Saturday and continued to reach resistance at $3976 on Sunday (1.272 Fib Extension). This resistance was not penetrated until yesterday when ETH surged to $4200.
Today, ETH penetrated the resistance at $4205 to set a new ATH price at $4365. The cryptocurrency reached resistance at the upper boundary of an ascending price channel that it has been trading inside since the end of April.
A break above this narrow price channel would truly send Ether parabolic in the short term.

ETH-USD Short Term Price Prediction
Looking ahead, the first resistance lies at the upper boundary of the price channel at $4365. This is followed by $4353 (1.618 Fib Extension), $4756 (1.272 Fib Extension – blue), and $5000. Beyond $5000, resistance lies at $5050, $5250, $5475 (1.618 Fib Extension), and $5600.
On the other side, the first support lies at $4200. This is followed by $4000, $3795 (.236 Fib), the lower boundary of the price channel, $3437 (.382 Fib), and $3250.
The RSI continues to remain extremely overbought as the bullish momentum completely dominates the market.
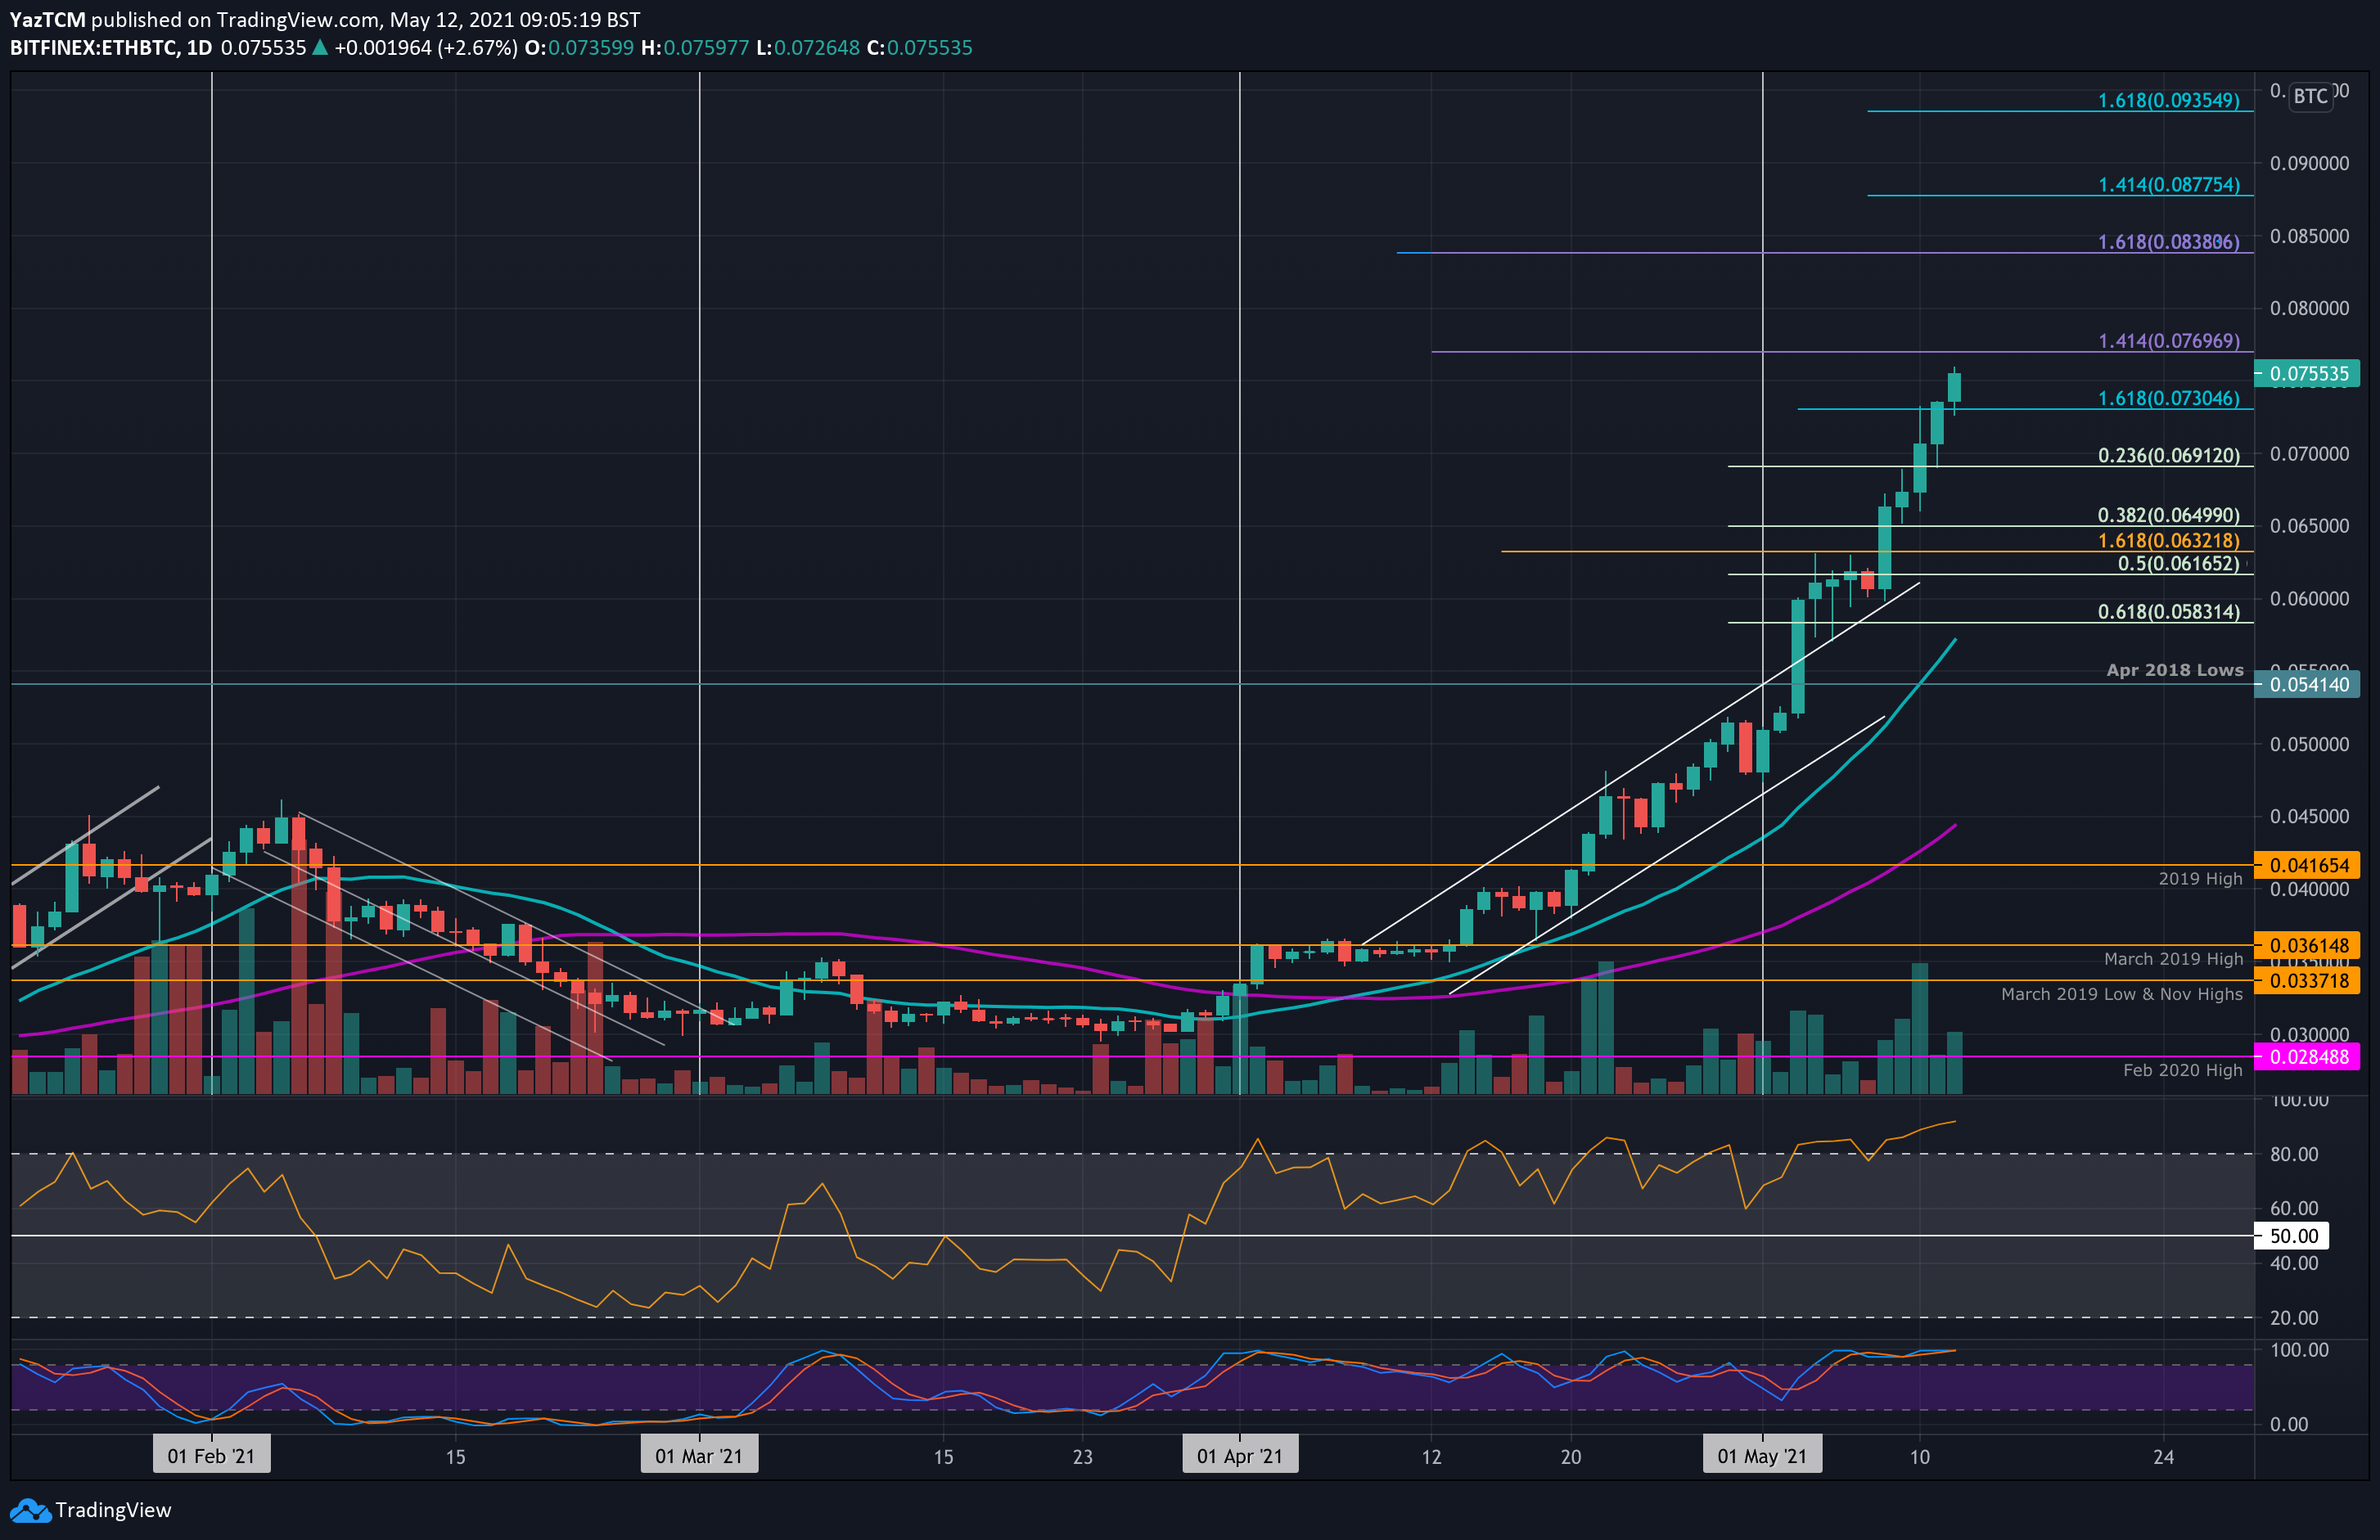
ETH/BTC – Bulls Set Sights For 0.08 BTC
Key Support Levels: 0.073 BTC, 0.0691 BTC, 0.065 BTC.
Key Resistance Levels: 0.0769 BTC, 0.08 BTC, 0.0838 BTC.
Ether also continues to set new highs against BTC this week. It penetrated above 0.07 BTC on Monday and reached resistance at 0.073 BTC (short-term 1.618 Fib Extension).
This resistance was penetrated today as ETH continued higher to break 0.075 BTC and hit 0.0755 BTC.

ETH-BTC Short Term Price Prediction
Looking ahead, if the bulls continue to press higher, the first resistance lies at 0.0769 BTC (1.414 Fib Extension). This is followed by 0.08 BTC, 0.0838 BTC (1.618 Fib Extension), 0.085 BTC, and 0.0877 BTC.
On the other side, the first support lies at 0.073 BTC. This is followed by 0.0691 BTC (.236 Fib), 0.065 BTC (.382 Fib), 0.0632 BTC, and 0.0616 BTC.
Again, the RSI remains extremely overbought as the buyers dominate the market momentum.


