Ethereum Price Analysis: ETH Rebounds 60% From Yesterday’s Low, What’s Next?

ETH/USD – Ether Finds Support At .786 Fib
Key Support Levels: $2,775, $2444, $2200,.
Key Resistance Levels: $3000, $3211, $3487.
The severe price crash seen yesterday caused ETH to drop by a total of around 40% from high to low. During the session, ETH fell as low as $1850, where it found support at the February highs. By the end of the day, the buyers had pushed higher to allow the daily candle to close above $2,444 (.786 Fib).
Today, ETH recovered by an astonishing 60% and has pushed back above resistance at the 50-day MA and a bearish .382 Fib Retracement at $2935 to close back in on $3000.

ETH-USD Short Term Price Prediction
Looking ahead, if the bears push ETH lower, the first strong support lies at $2775 (50-day MA). This is followed by $2444 (.786 Fib), $2200 (.886 Fib & 100-day MA), $2036 (Feb highs), and $1900.
On the other side, the first strong resistance lies at $3000. This is followed by $3211 (bearish .5 Fib), $3487 (bearish .618 Fib & 20-day MA), and $3,880 (bearish .786 Fib).
The RSI is in the bearish favor but is not in extremely oversold conditions. It is also pointing higher, which indicates the previous bearish momentum might be showing signs of fading.
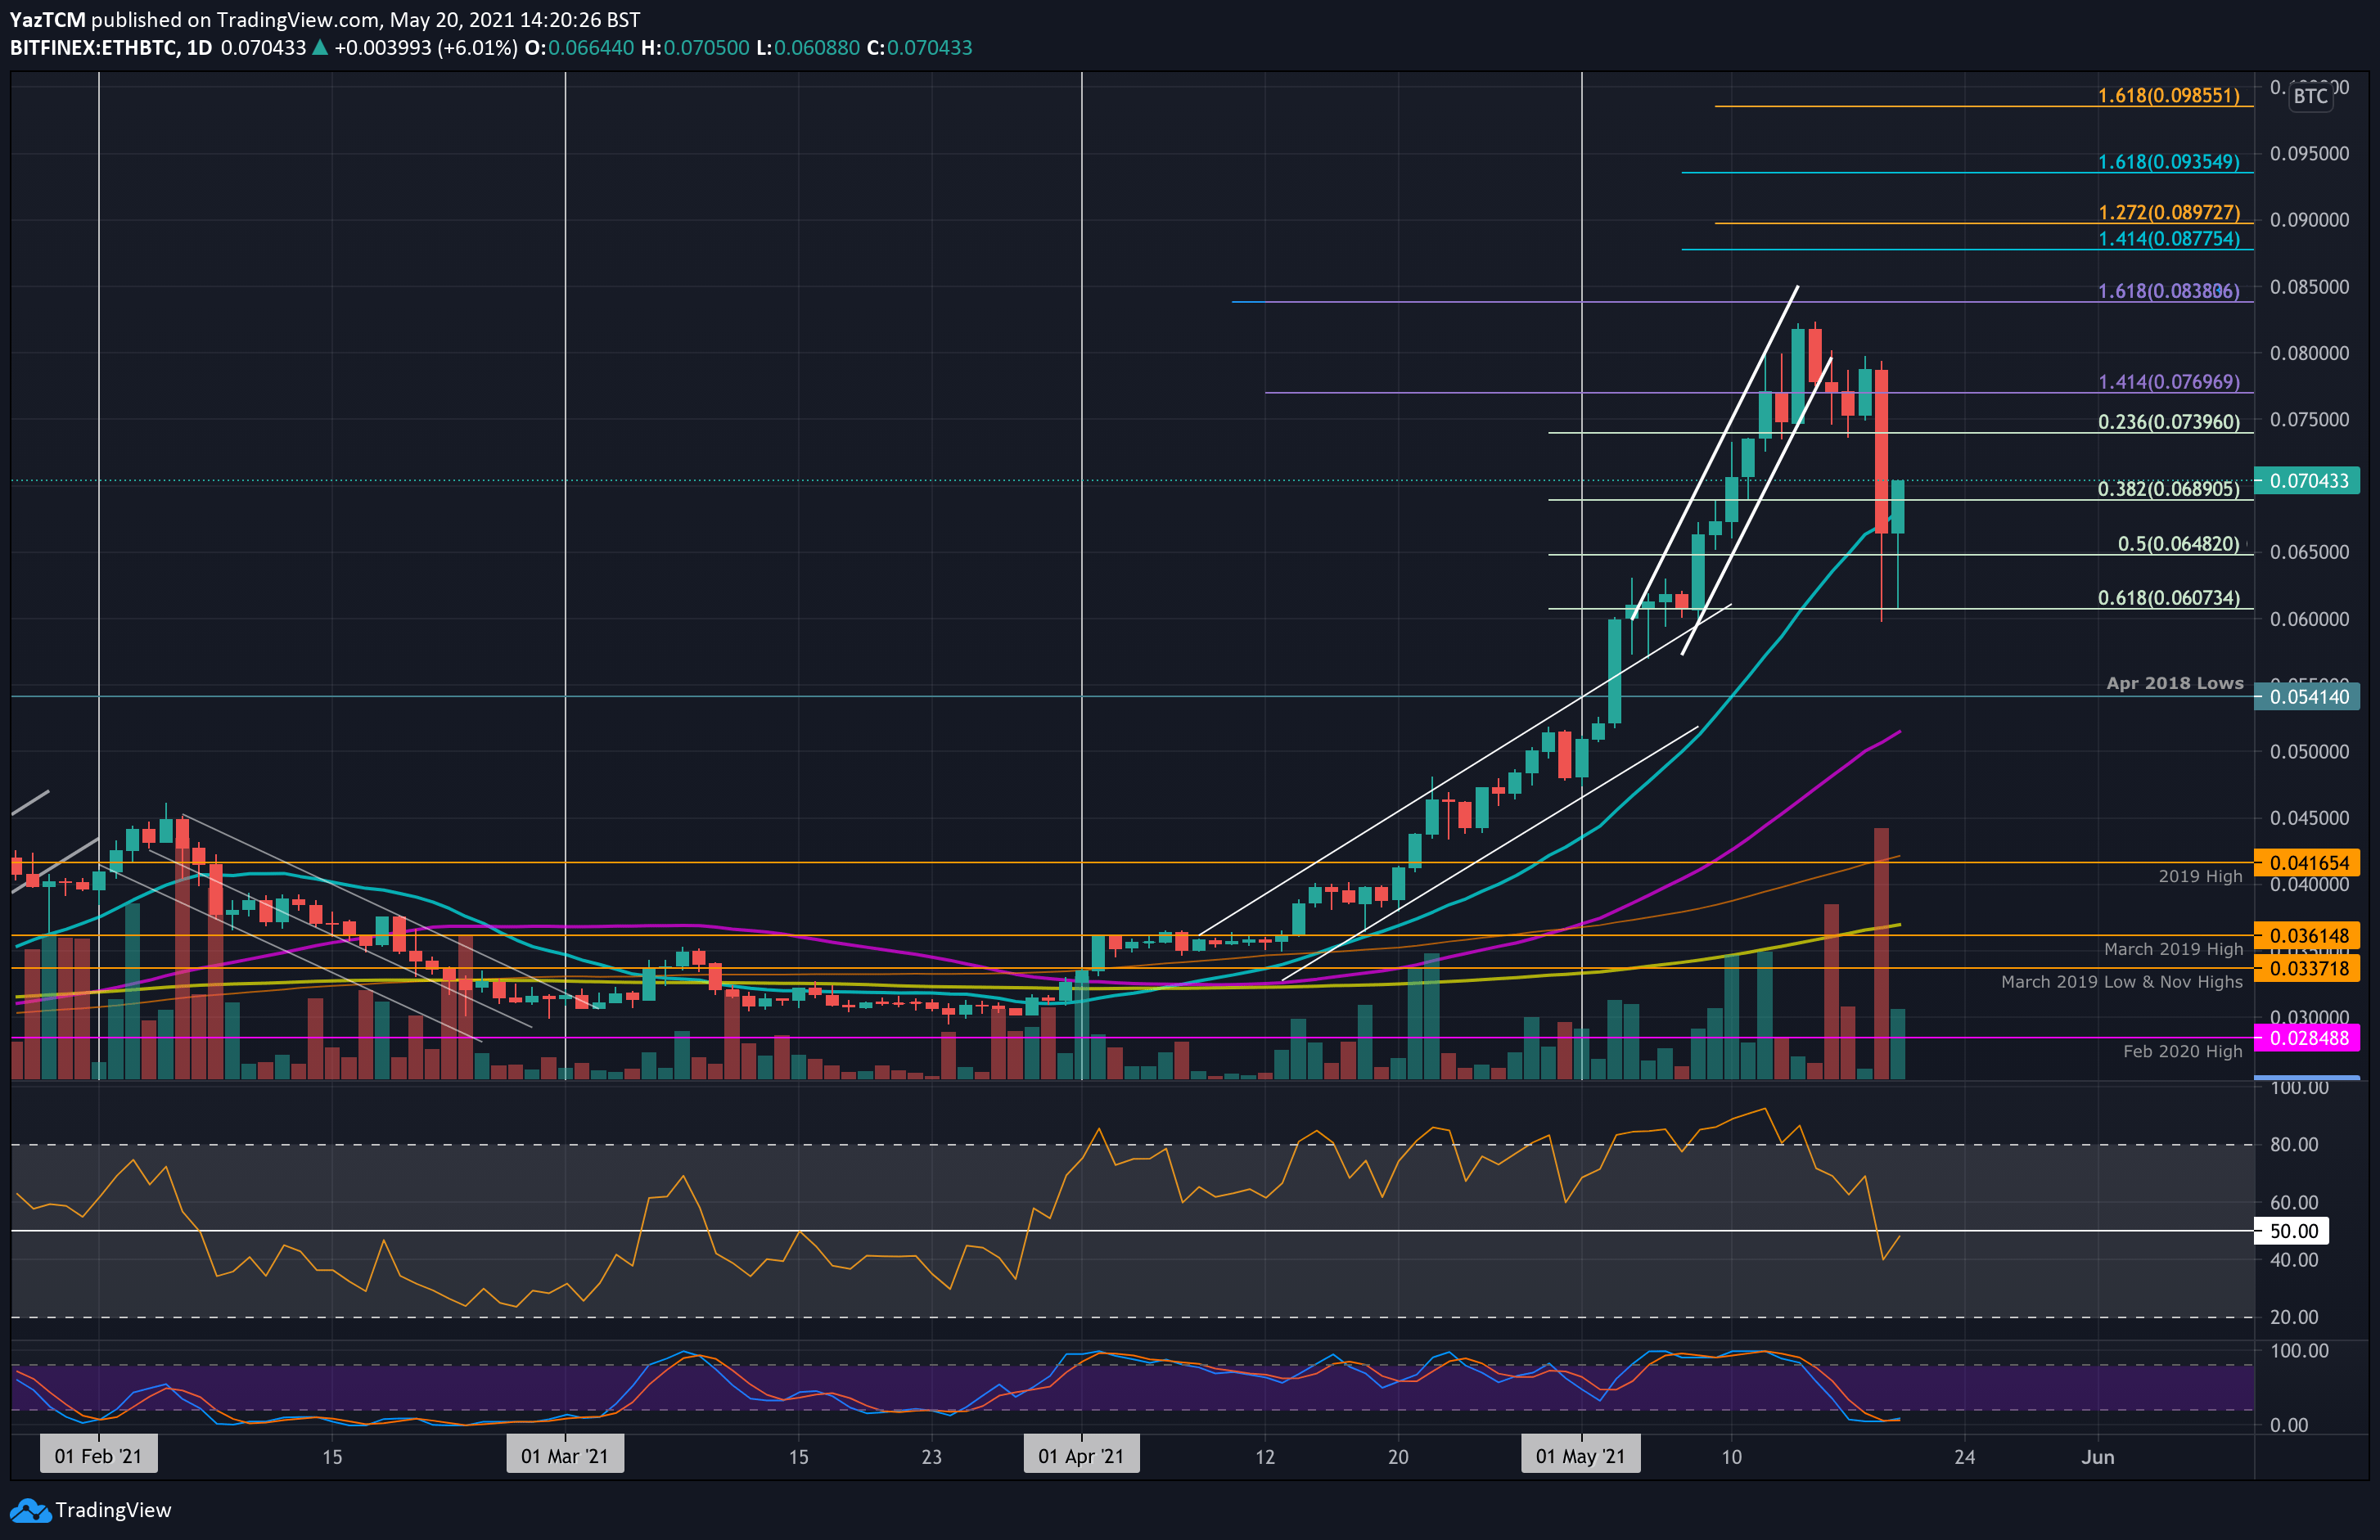
ETH/BTC – Ether Finds Support At 0.06 BTC
Key Support Levels: 0.0689 BTC, 0.0648 BTC, 0.06 BTC.
Key Resistance Levels: 0.0715 BTC, 0.074 BTC, 0.075 BTC.
Ether also dropped significantly against BTC yesterday. The cryptocurrency was trading near 0.08 BTC at the start of the day but quickly plummetted as low as 0.06 BTC during the session. ETH pushed higher to close around 0.0667 BTC by the time the daily candle closed.
Today, ETH did dip back toward 0.0607 BTC (.618 Fib) at the start of the session but has since pushed back above the 20-day MA and is now above 0.07 BTC again.
ETH-BTC Short Term Price Prediction
Looking ahead, the first support lies at 0.0689 BTC (.382 Fib & 20-day MA). This is followed by 0.0648 BTC (.5 Fib), 0.06 BTC (.618 Fib), 0.0541 BTC (April 2018 lows), and 0.0515 BTC (50-day MA).
On the other side, the first resistance lies at 0.0715 BTC. This is followed by 0.074 BTC, 0.075 BTC, and 0.0769 BTC (1.414 Fib Extension).
The RSI recently dropped beneath the midline during yesterday’s drop. However, it has started to make its way back to neutral territory. Additionally, the Stochastic RSI is already extremely oversold and is primed for a bullish crossover signal.
