Cardano Price Analysis: ADA Struggles To Maintain The Critical $1.50, What’s Next?

ADA/USD – Bulls Battle To Maintain $1.50
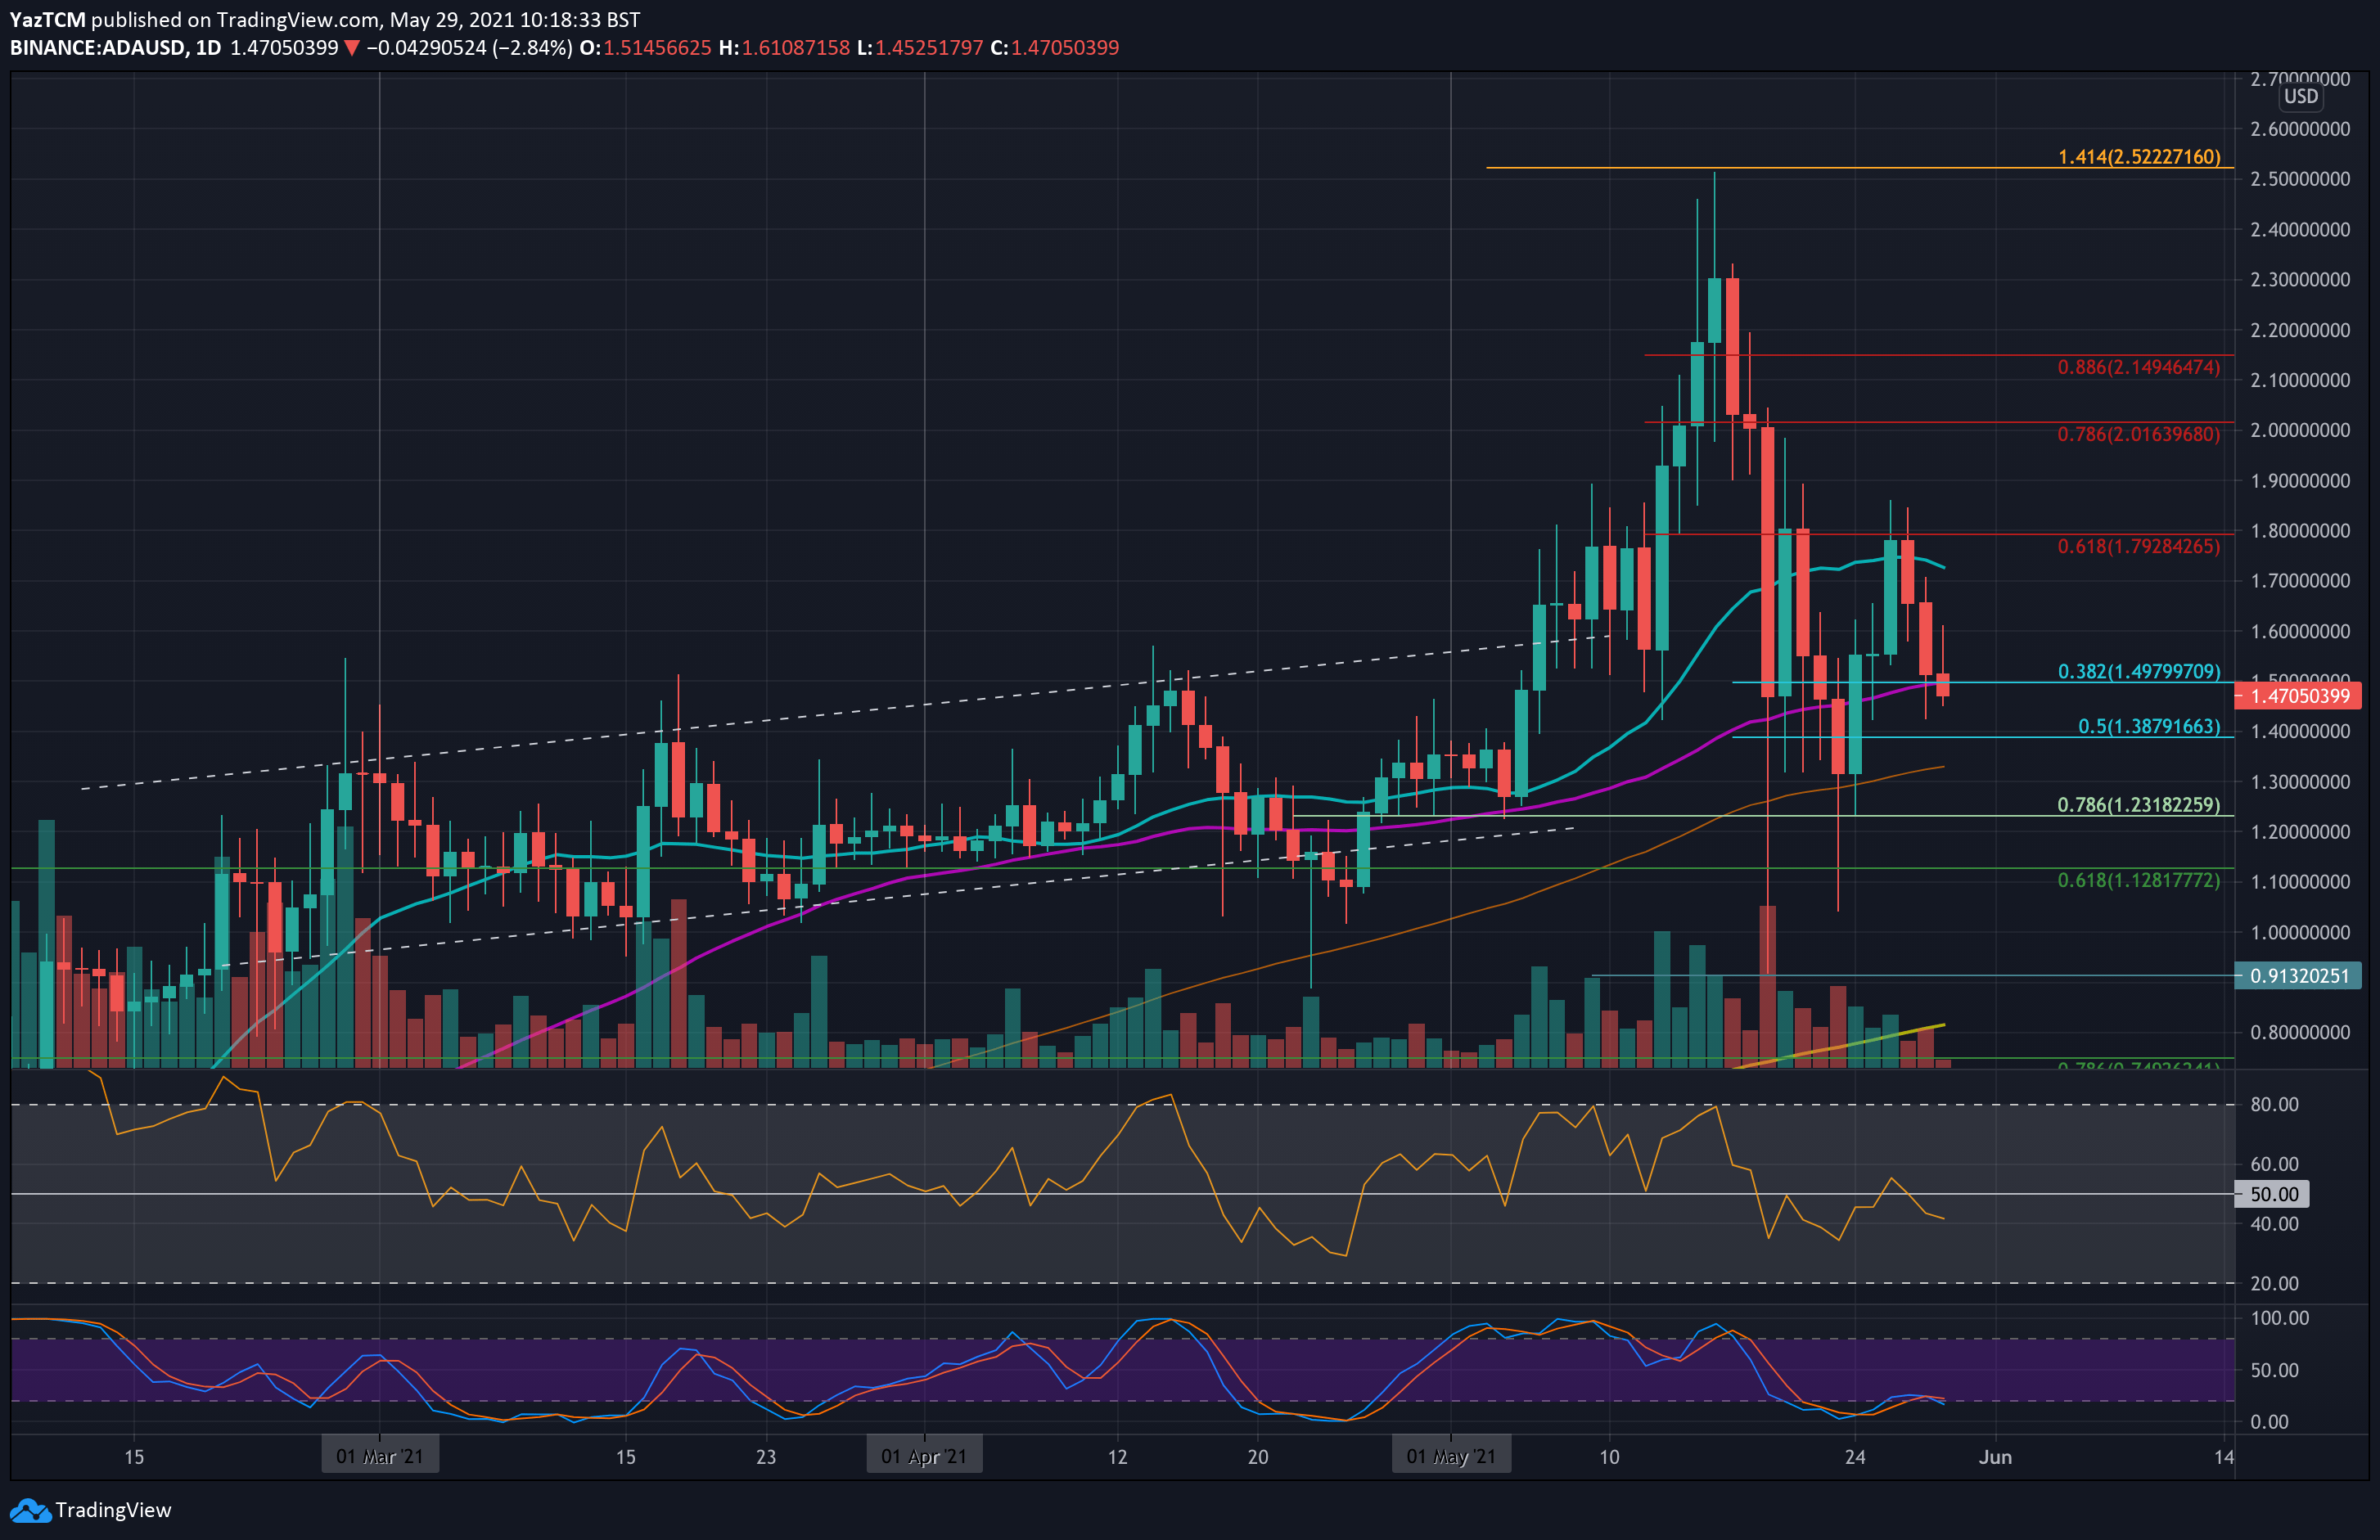
Key Support Levels: $1.50, $1.38, $1.30, $1.23.
Key Resistance Levels: $1.50, $1.60, $1.80.
After dropping from the ATH at $2.50 earlier in the month during the crypto washout of May-19, ADA found support and surged higher from $1.23 at the beginning of the week to reach resistance at $1.80 (bearish .618 Fib) on Wednesday. There, it encountered solid resistance and ended up rolling over from there.
As of now, the bulls attempt to defend around the confluence zone of $1.50 (.382 Fib & 50-day MA), while ADA trades slightly below it, as of writing these lines.
ADA-USD Short Term Price Prediction
Looking ahead, the first support lies at $1.38 (.5 Fib). This is followed by $1.30 (100-day MA), $1.23 (.786 Fib), $1.12 (long term .618 Fib), and $1.00.
On the other side, the first resistance now lies at $1.50 (50-day MA). This is followed by $1.60, $1.80 (bearish .618 Fib), $1.90, and $2.00 (bearish .786 Fib).
The RSI, the momentum indicator, hints of hidden bearish divergence from earlier in the week, eventually leading to the rollover back toward $1.50. It is now trading beneath the midline, indicating weak bearish momentum. If the RSI continues to dip over the coming days, the increased bearish momentum will likely push ADA toward the 100-day MA.
ADA/BTC – ADA Rejected By Symmetrical Triangle Upper Angle.
Key Support Levels: 4150 SAT, 4000 SAT, 3780 SAT.
Key Resistance Levels: 4450 SAT, 4570 SAT, 4900 SAT.
ADA rebounded from support at 3780 SAT (.382 Fib) at the start of the week as it pushed higher above 4000 SAT to reach as high as 4570 SAT (1.414 Fib Extension). There, it found resistance at the upper angle of a wide symmetrical triangle pattern and was rejected at this level.
It rolled over from there to the current 4180 SAT level as the bulls attempt to defend a short-term ascending trend line around 4150 SAT.

ADA-BTC Short Term Price Prediction
Moving forward, the first support lies at 4150 SAT (ascending trend line & 20-day MA). This is followed by 4000 SAT, 3780 SAT (.382 Fib & lower angle of triangle), 3420 SAT (.5 Fib), and 3200 SAT.
On the other side, the first resistance lies at 4450 SAT (upper angle of the triangle). This is followed by 4570 SAT (1.414 Fib Extension), 4900 SAT (1.618 Fib Extension), and 5000 SAT.
The RSI is trading at the midline, indicating indecision within the market. If it breaks beneath 50, the bearish momentum is likely to send ADA back toward the lower angle of the symmetrical triangle.