Cardano Price Analysis: ADA Remains Indecisive Around $1.5 as Bulls Struggle With Momentum

ADA/USD – ADA Trades Inside Symmetrical Triangle
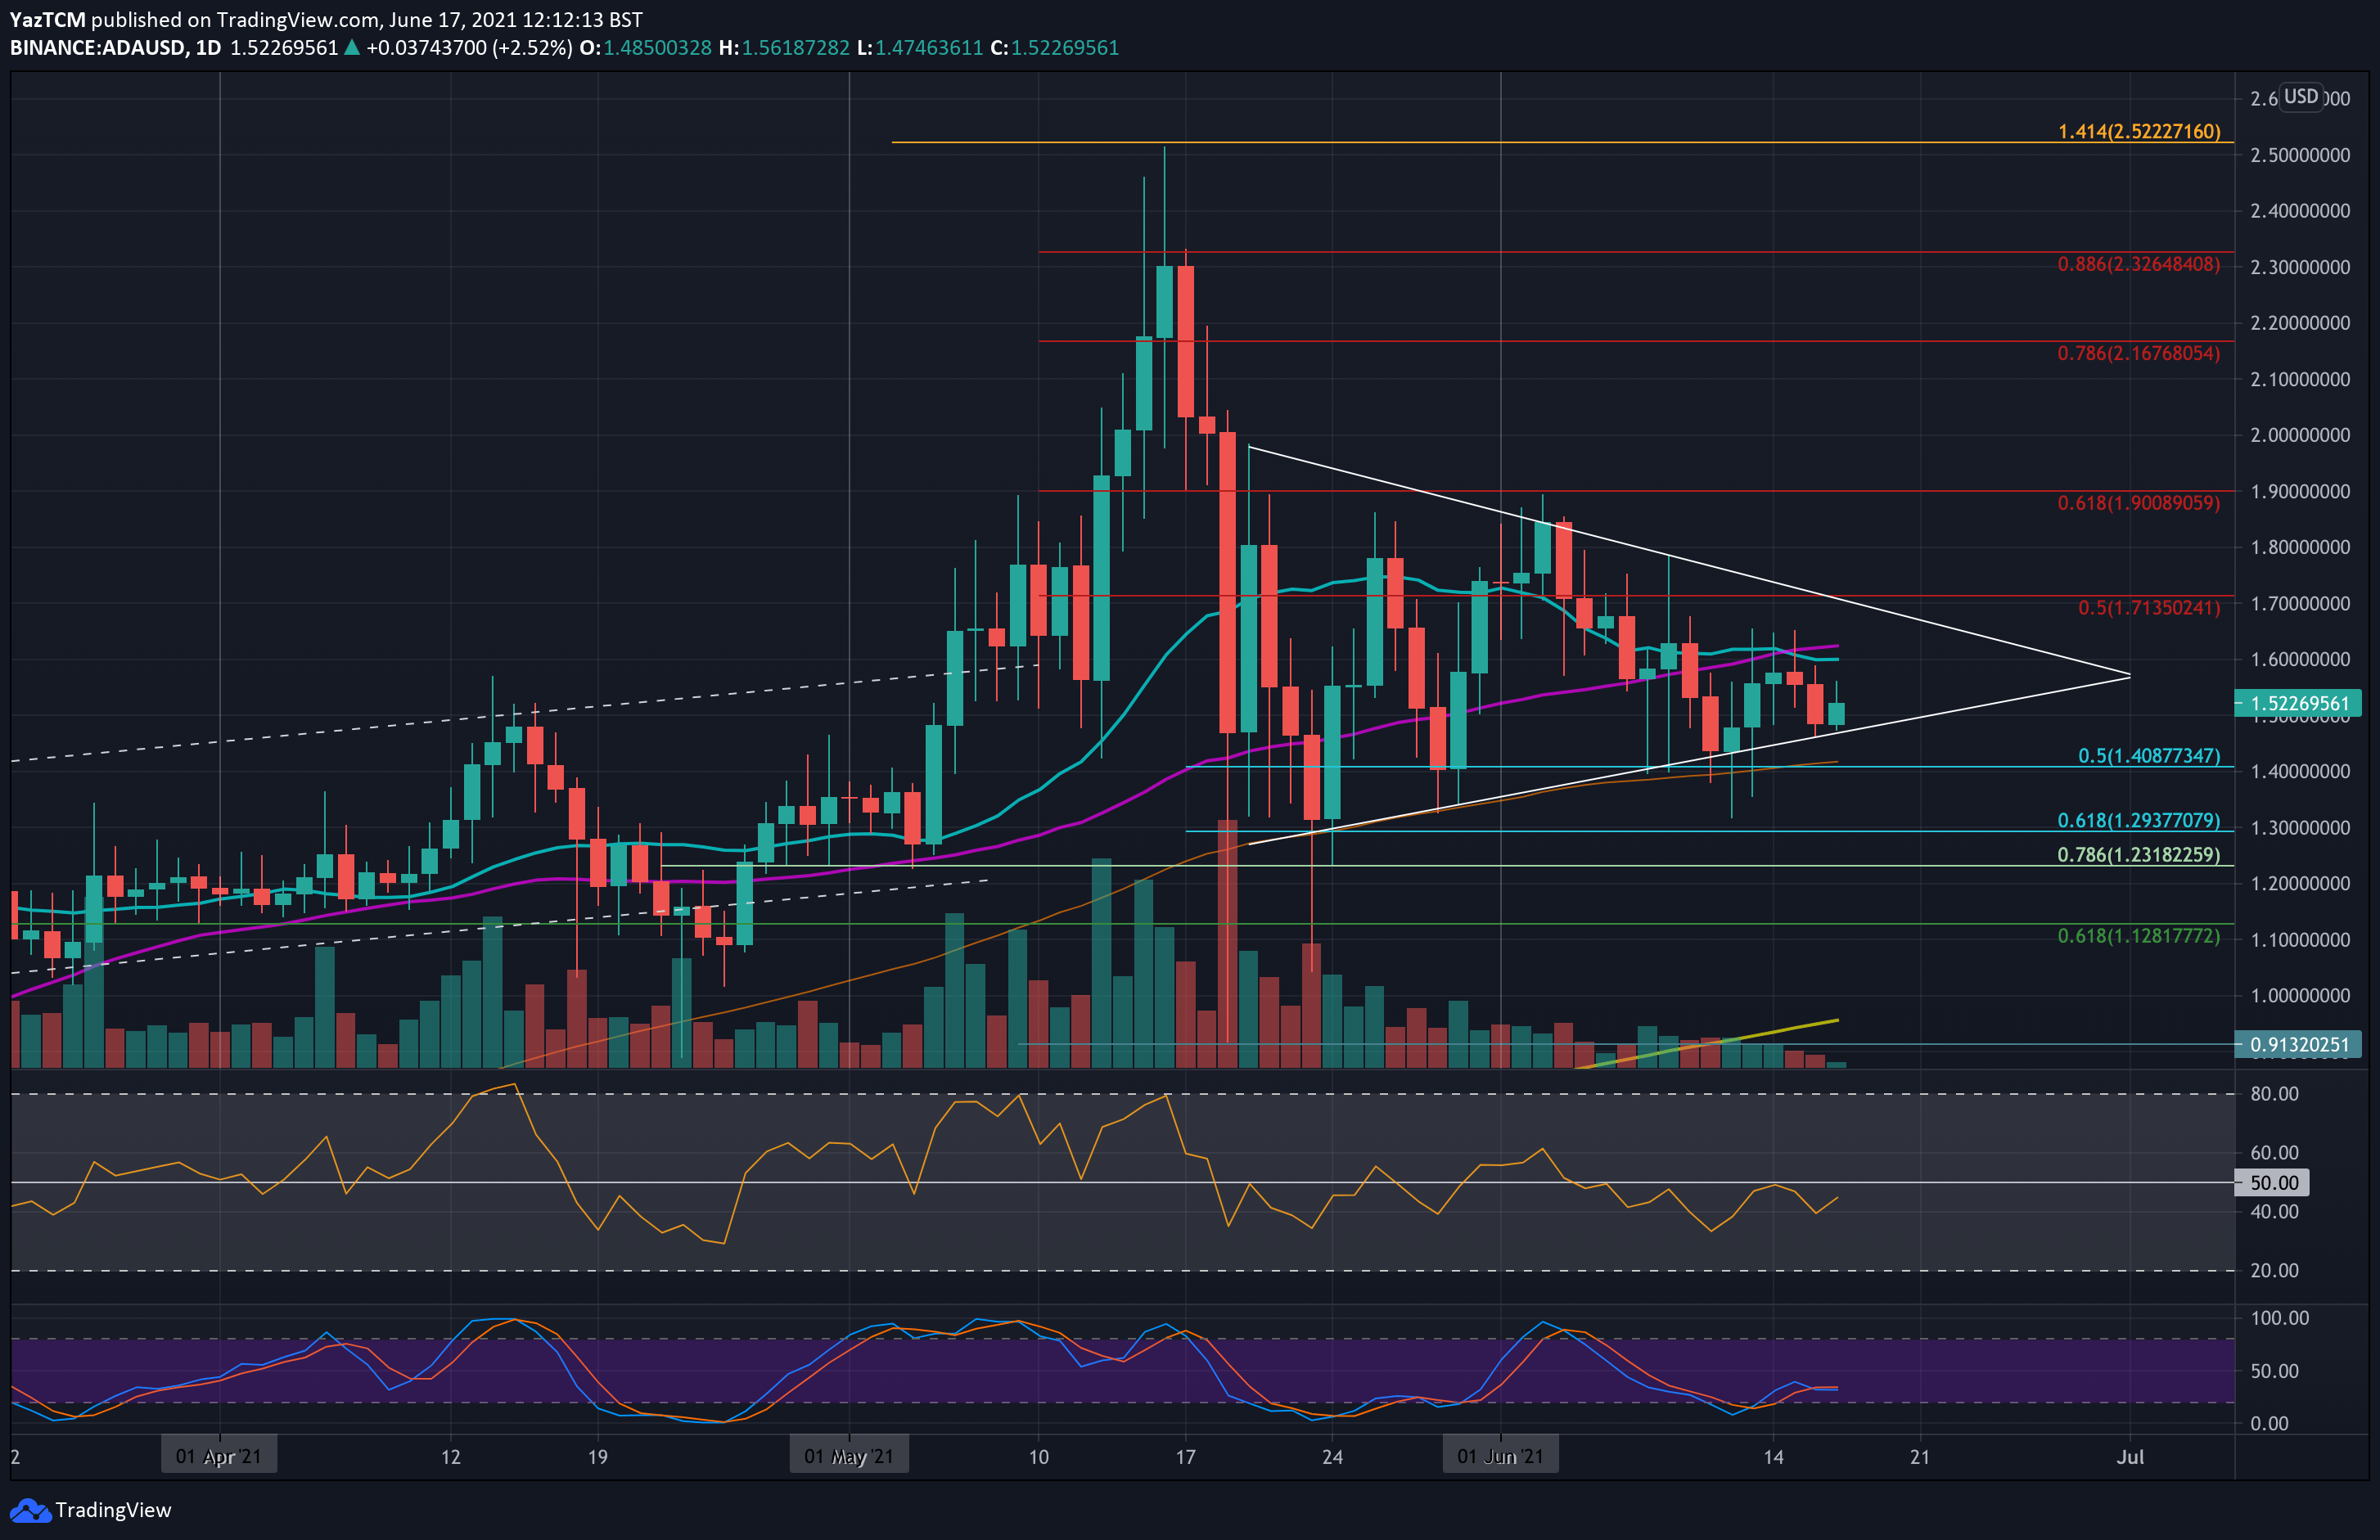
Key Support Levels: $1.50, $1.40, $1.30.
Key Resistance Levels: $1.60, $1.70, $1.80.
ADA has been consolidating for almost a month now as it trades inside a symmetrical triangle pattern. It surged higher at the end of May but found resistance at the upper boundary of the triangle at the start of June.
From there, ADA started to head lower and broke beneath the 50-day MA last week. It recently found support at the lower boundary of the symmetrical triangle as it battles to stay above $1.50.
ADA-USD Short Term Price Prediction
Looking ahead, the first support lies at the lower boundary of the triangle, around $1.50. This is followed by $1.40 (.5 Fib & 100-day MA), $1.30 (.618 Fib), and $1.23 (long term .786 Fib).
On the other side, the first resistance lies at $1.60 (20-day & 50-day MA0. This is followed by $1.70 (upper boundary of the triangle & bearish .5 Fib), $1.80, and $1.90 (bearish .618 Fib).
The RSI is beneath the midline but is battling to head back toward it, indicating weak bearish momentum. It would need to break above the midline and pass the 60 level to break to the upside of the triangle.
ADA/BTC – ADA Finds Support At 50-Day MA
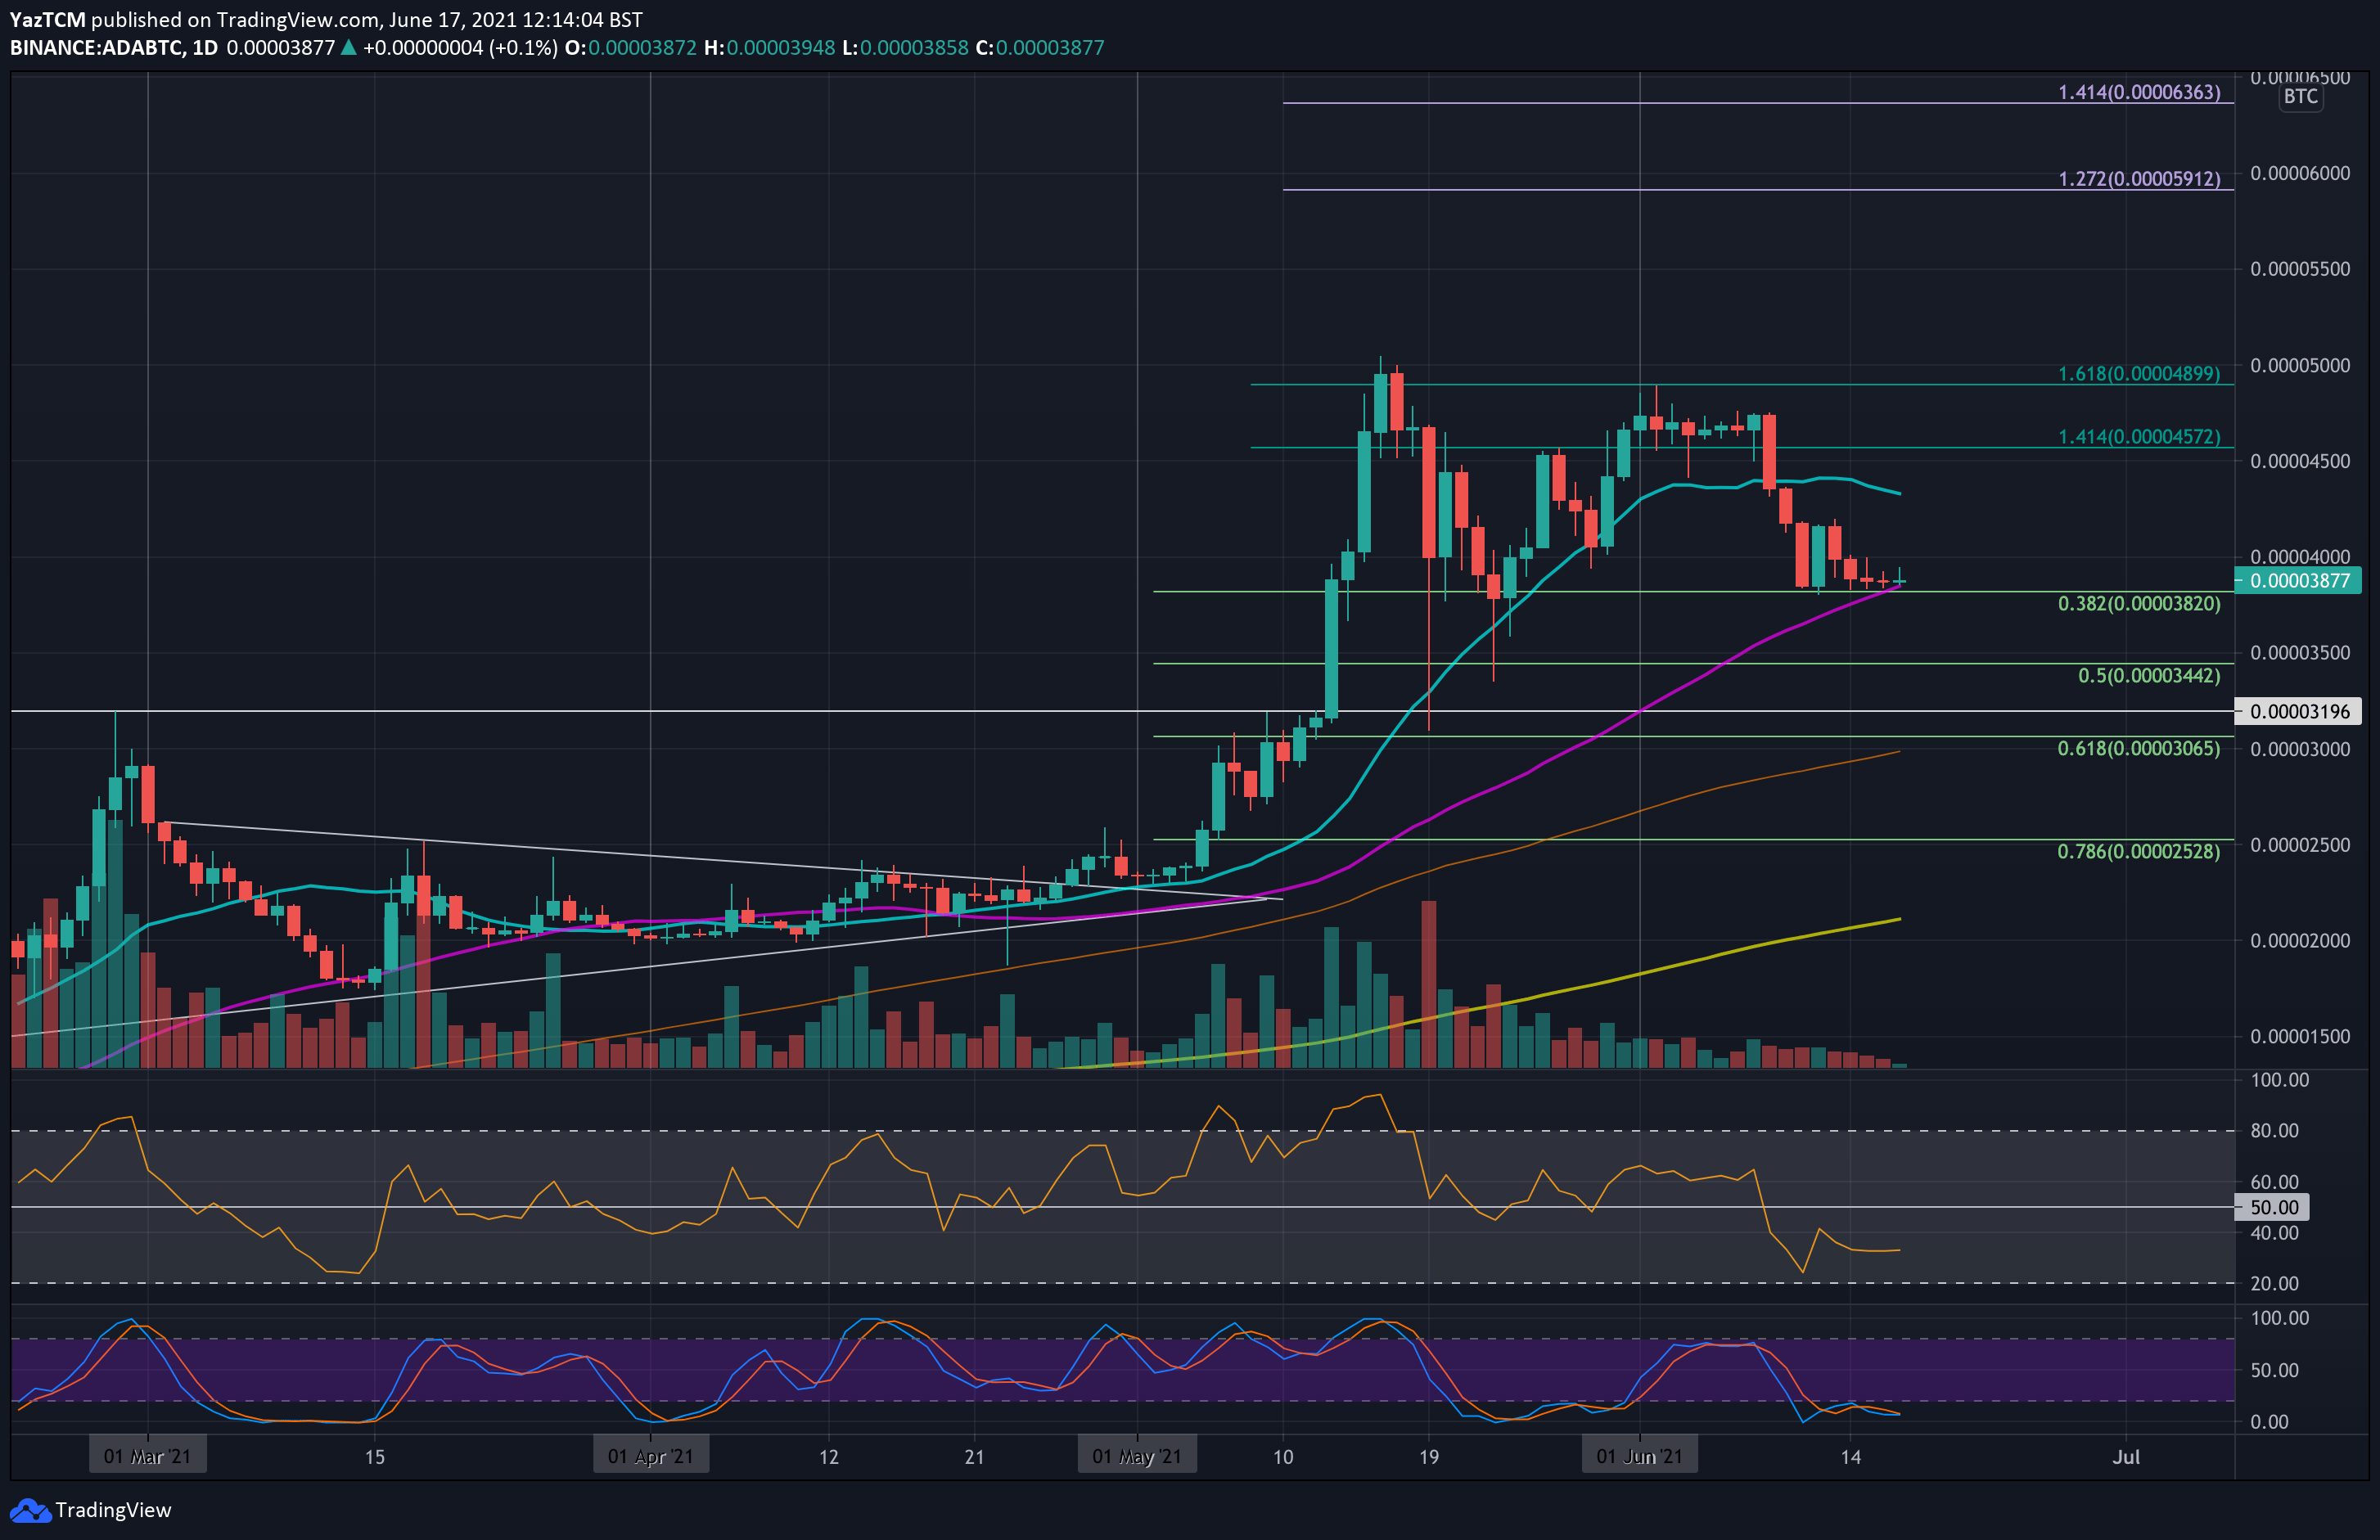
Key Support Levels: 3820 SAT, 3440 SAT, 3200 SAT.
Key Resistance Levels: 4000 SAT, 4400 SAT, 4570 SAT.
ADA failed to break resistance at 4900 SAT at the beginning of June. Last week, it dropped beneath the 20-day MA and continued down to 3820 SAT (.382 Fib).
Since then ADA has struggled to make ground above 4000 SAT but has done well to remain above the 3820 SAT support which is now further bolstered by the 50-day MA level.
ADA-BTC Short Term Price Prediction
Moving forward, the first resistance lies at 4000 SAT. This is followed by 4400 SAT (20-day MA), 4570 SAT (1.414 Fib Extension), 4900 SAT (1.618 Fib Extension), and 5000 SAT.
On the other side, the first support lies at 3820 SAT (.382 Fib & 50-day MA). This is followed by 3440 SAT (.5 Fib), 3200 SAT, and 3000 SAT (100-day MA).
The RSI is well beneath the midline, indicating the bears are in total control of the market momentum here. However, the Stochastic RSI is extremely oversold and should be primed for a bullish crossover signal soon.