Bitcoin Price Analysis: BTC Broke to the Downside, Is Another $30K Retest Incoming?
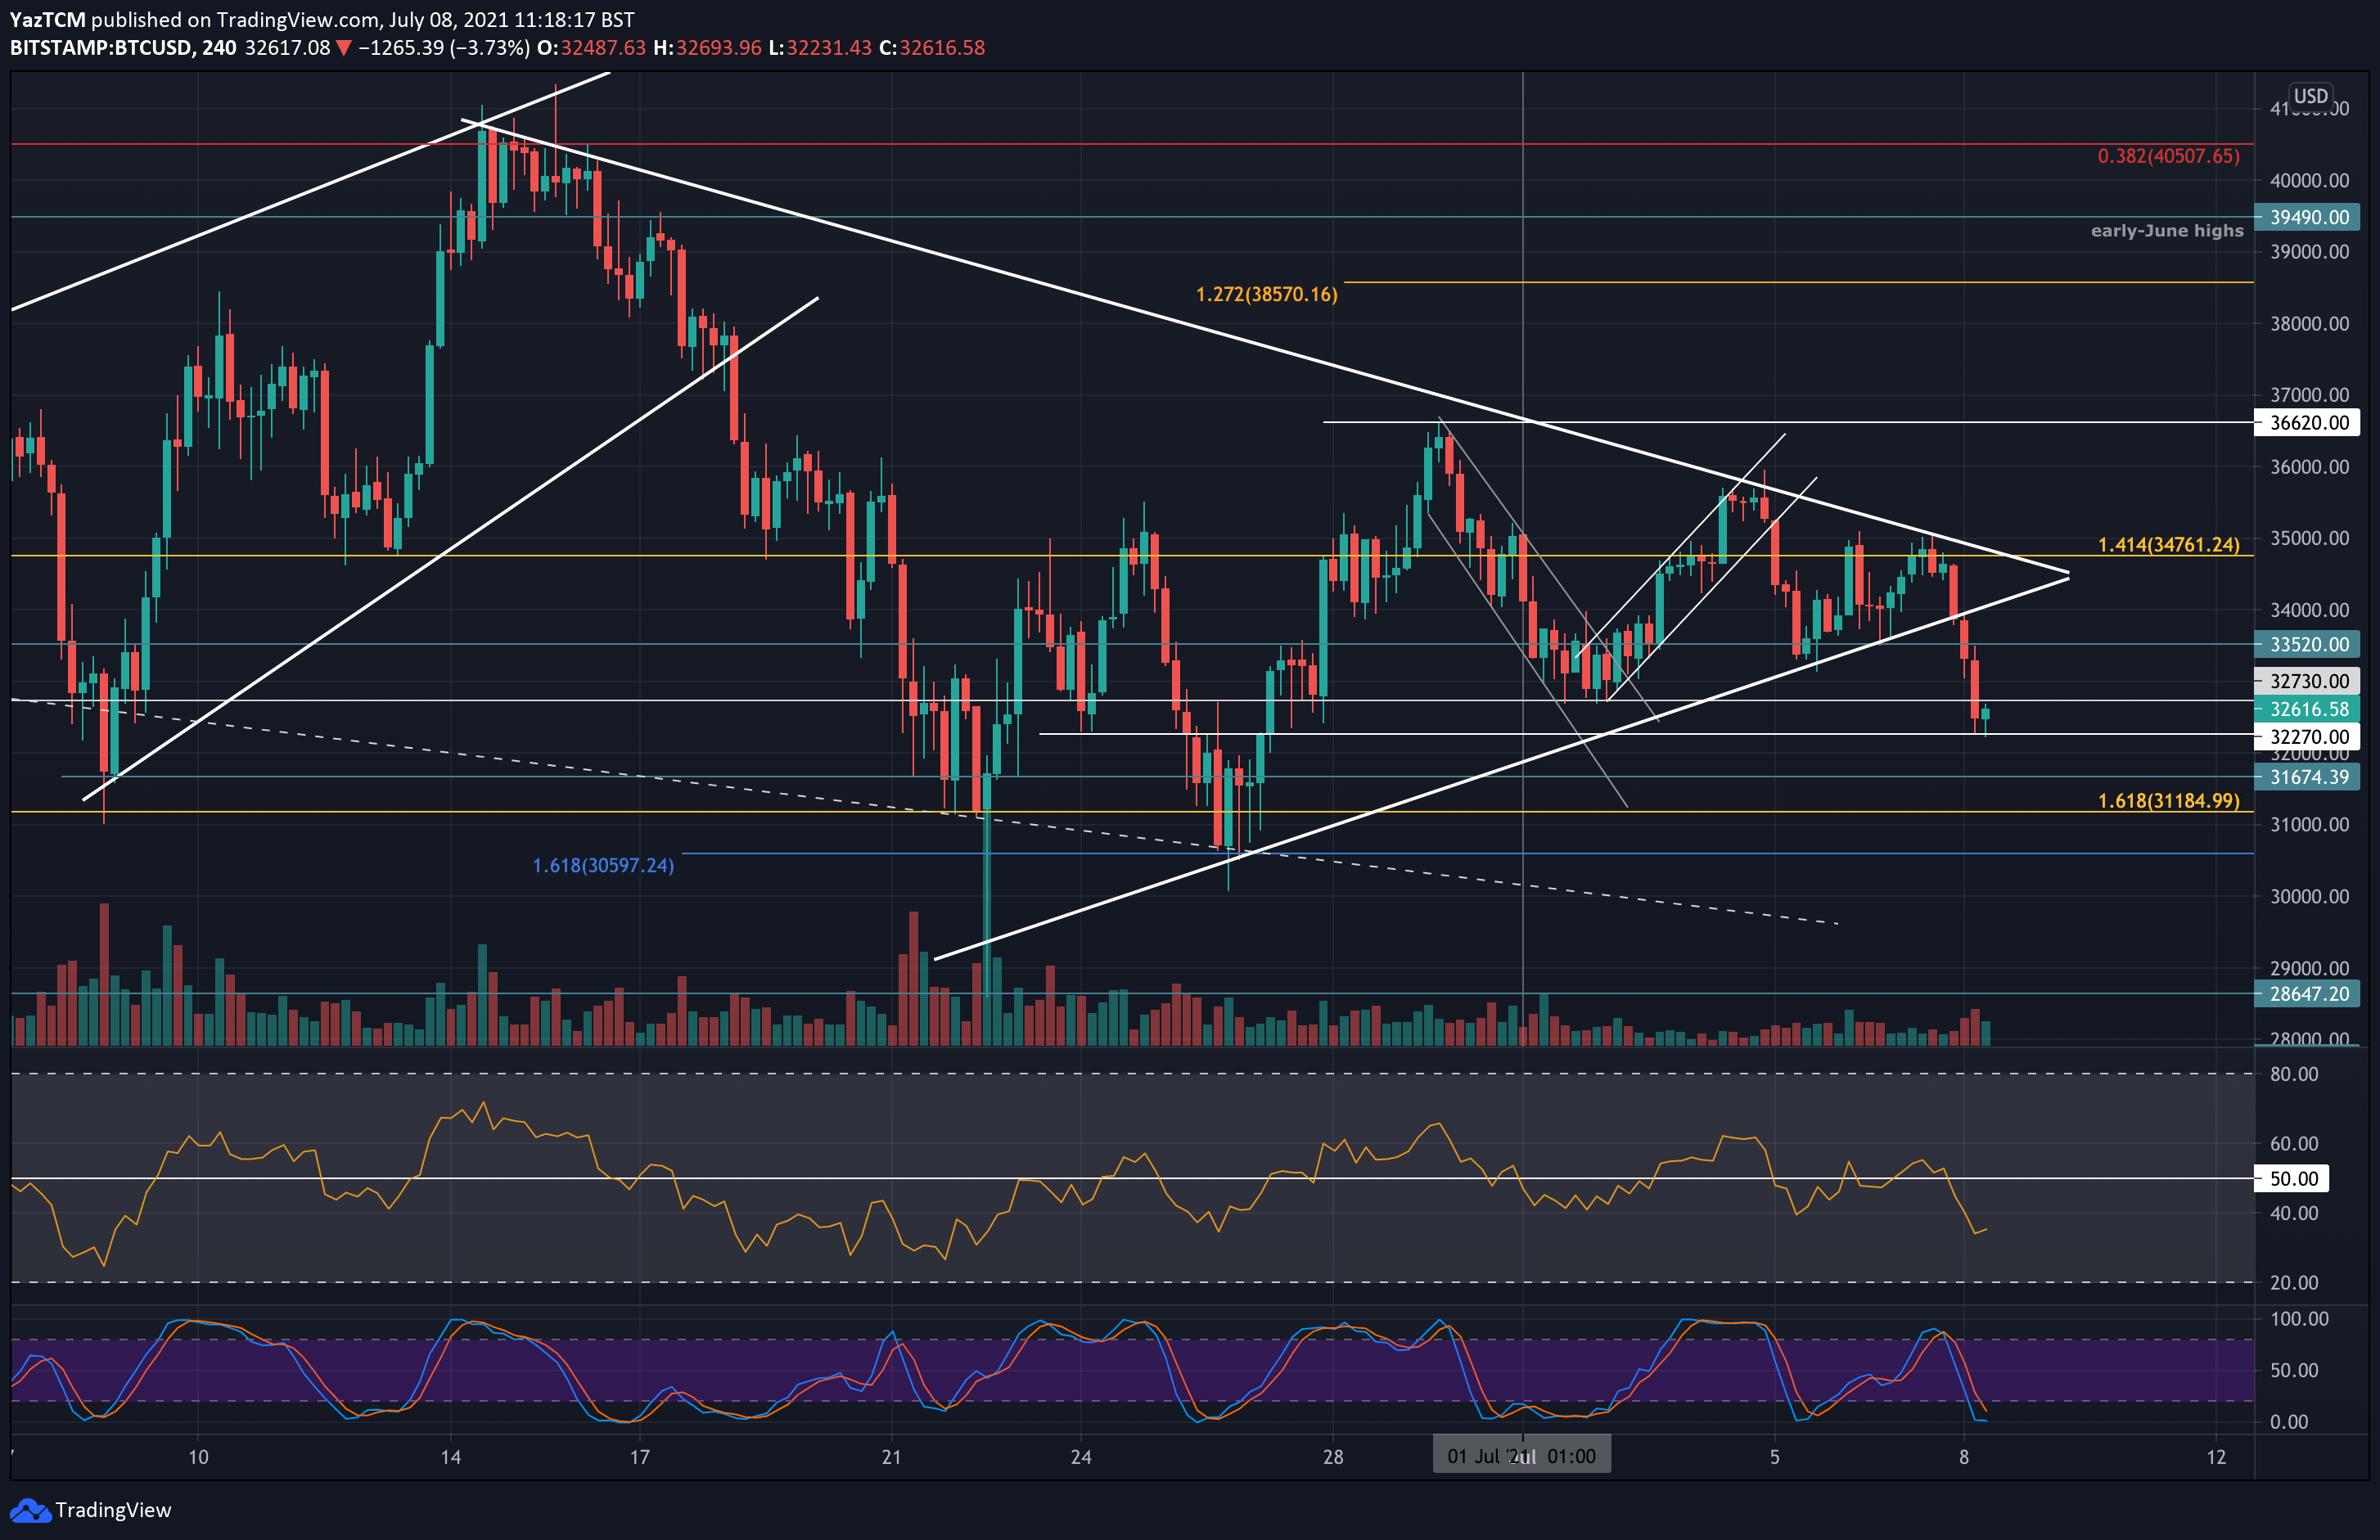
BTC dropped a sharp 6% today as it fell through the lower angle of a short-term symmetrical triangle pattern.
As mentioned here yesterday, a huge price move was anticipated due to the decreasing amounts of the trading volume, along with reaching the apex of a symmetrical triangle.
Indeed, the move came, and the bearish breakout saw BTC dropping almost $3000 since reaching yesterday’s high amid $35K. Today’s low set a fresh low for the month of July 2021, and it is also the lowest price bitcoin traded at since June 27.
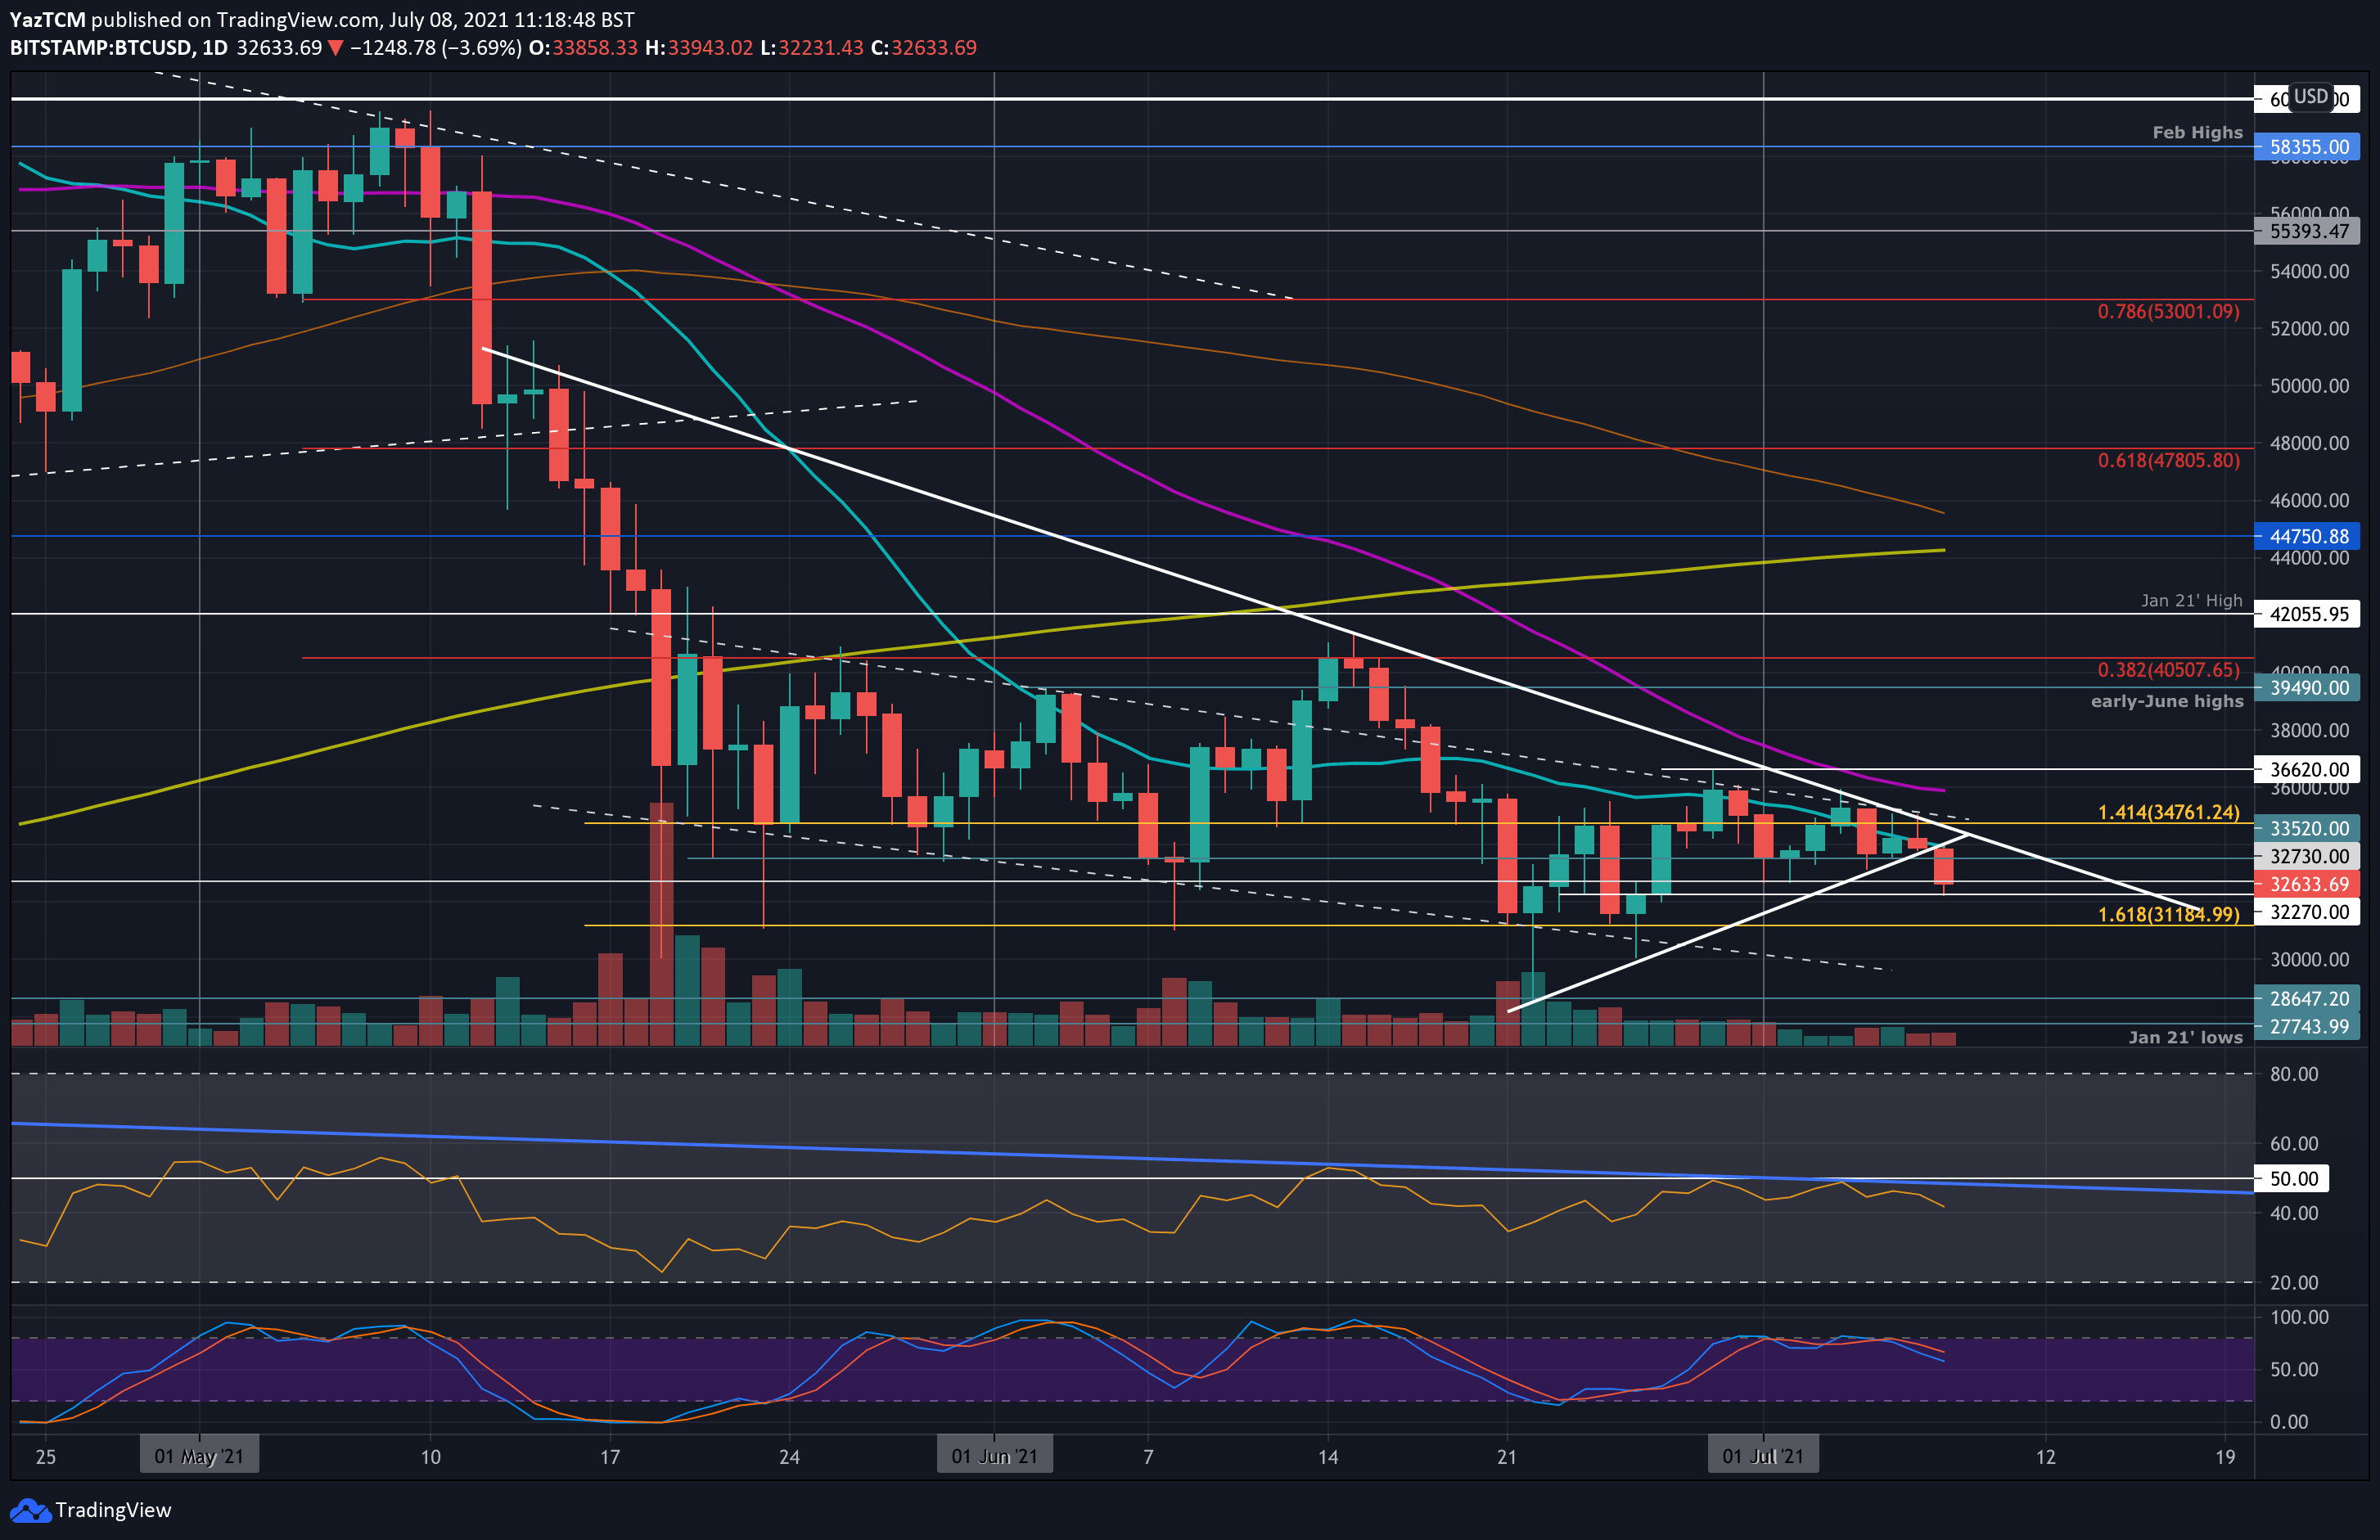
Before the breakdown, BTC was consolidating inside the short-term triangle pattern. It was consolidating amid the 20-day moving average line for the past days (blue line as shown on the following daily chart); however, bitcoin price failed to sustain above it, which led to the sharp breakdown today.
Following the breakdown, BTC’s price is now below the ascending trend line that has supported the market since June 22nd and can be facing short-term bearish action, as the long-term resistance trend line on the daily RSI got rejected once again, preventing BTC from establishing the first lower-high since February 2021.
With today’s breakdown, all eyes now rest on the support at $31,500, where BTC double-bottomed in the final week of June and was able to reclaim $36.6K shortly after.
Further below lies the significant support around the $30K mark, which was successfully maintained the market six times since May. As a reminder, since the liquidation crash on May-19, bitcoin is trading between $30K and $42K. A breakout from the range should lead to bitcoin’s next major move.
BTC Price Support and Resistance Levels to Watch
Key Support Levels: $32,270, $31,500, $31,185, $30,600, $30,000.
Key Resistance Levels: $32,700, $33,520, $34,000, $35,000, $35,900.
Looking ahead, the first support lies at $32,270 (today’s low). This is followed by $31,500 (double-bottom support from June), $31,185, $30,600 (downside 1.618 Fib Extension), and $30,000.
On the other side, the first resistance now lies at $32,700 (early July support, which now turned to resistance). This is followed by $33,520, $34,000 (20-day MA), $35,000, and $35,900 (50-day MA).
The daily RSI is trending lower, indicating increasing bearish momentum within the market in the short-term. The 4-hour RSI also made a new low in July as it breaks beneath the 40 level as the bears retake control, as the trading volume increase (but still very low compared to May 2021).
Bitstamp BTC/USD Daily Chart

Bitstamp BTC/USD 4-Hour Chart