Cardano Price Analysis: ADA Battling at Critical Support, Huge Move Incoming?

ADA/USD – ADA Hits 20-day MA Support
Key Support Levels: $1.34, $1.30, $1.20.
Key Resistance Levels: $1.40, $1.45 – 1.50, $1.72.
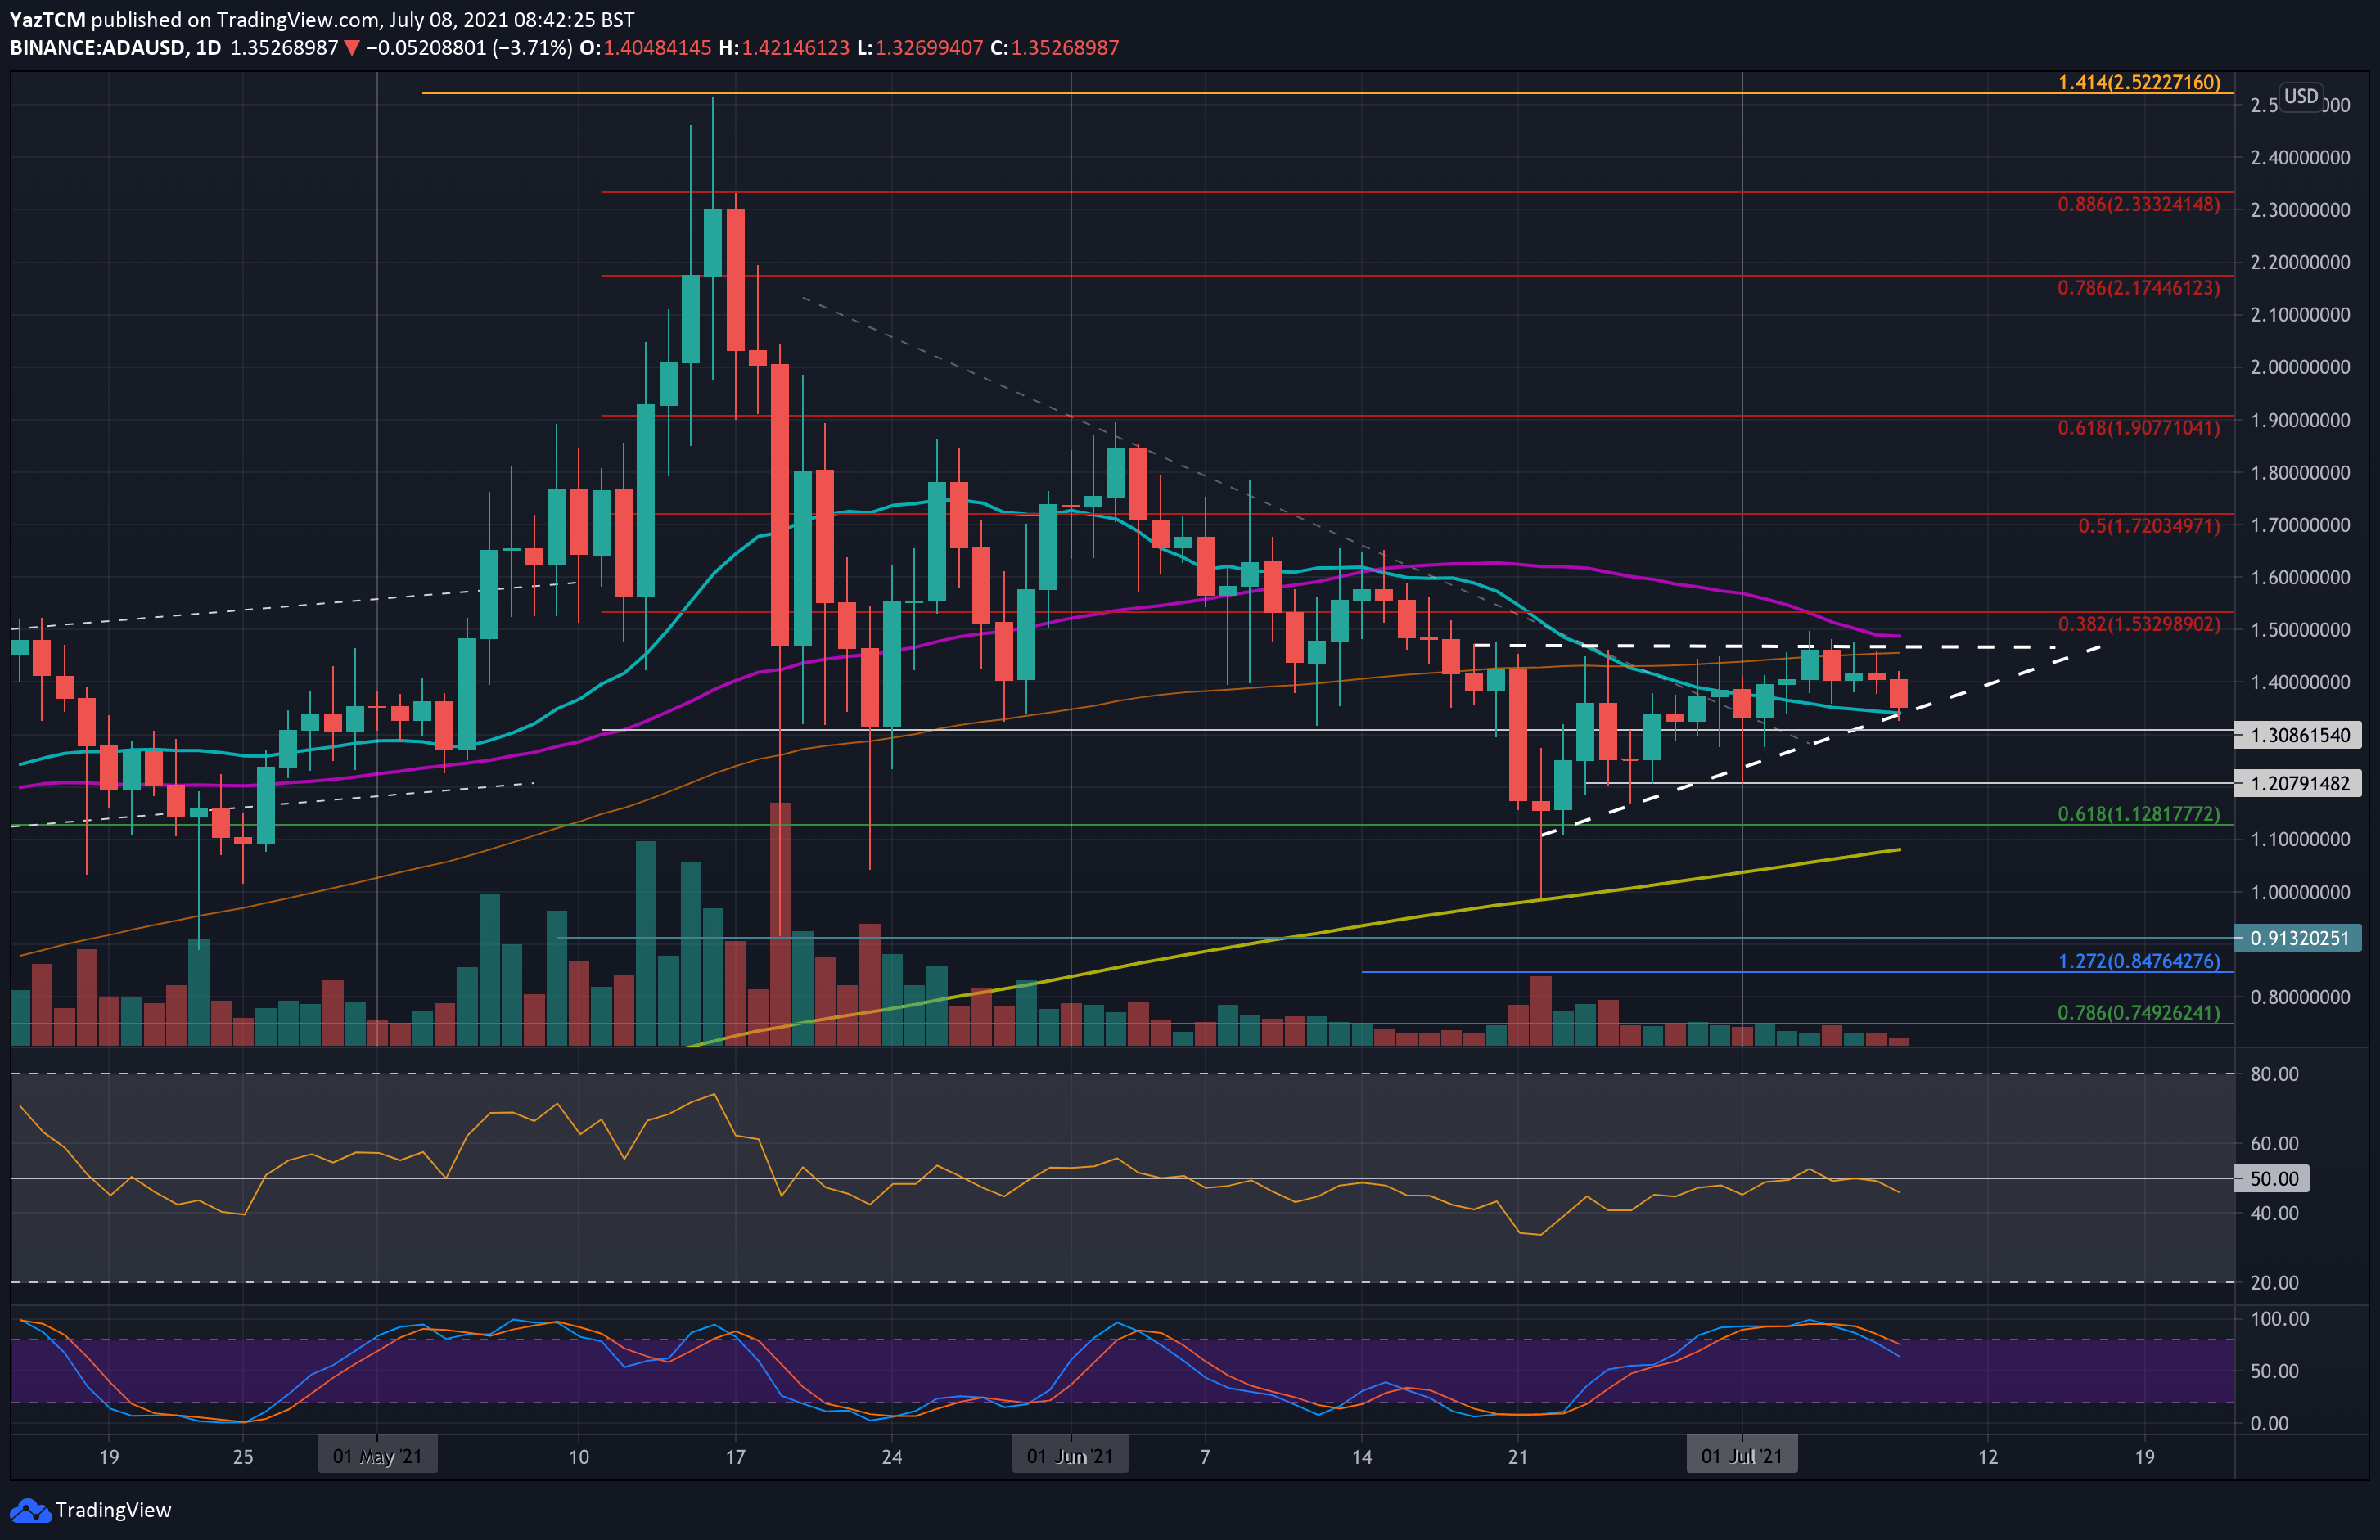
ADA is consolidating inside an ascending triangle pattern that was initiated toward the end of June. The coin tumbled to its lowest price in June and found support upon the 200-day MA live (yellow on the chart) at $1.00 and since then – rebounded sharply to form a bullish triangle.
This pattern tends to break upside (that’s why it’s called a bullish triangle); however, there is also the situation of a breakdown. As of writing these lines, the lower angle of the triangle is being tested before a possible break-down.
At the start of this month, July, ADA pushed higher and attempted to break toward the upside of the triangle. Unfortunately, it could not penetrate the roof at $1.48, further bolstered by the 100-day MA near there.
It has since dropped lower as it fell beneath $1.40 today to find the support at the lower angle of the triangle at $1.34, provided by the 20-day MA. The decreasing amount of volume is usually a sign anticipating a large price move. If the price can’t find support at current levels, the move will likely be toward the downside.
ADA-USD Short Term Price Prediction
Looking ahead, if the sellers break beneath the triangle and the 20-day MA (the blue line), the first support lies at $1.30. This is followed by $1.20 (July lows), $1.12 (.618 Fib Retracement), and $1.08 (200-day MA – the yellow line).
On the other side, the first resistance lies at $1.40. This is followed by a significant resistance range between $1.45 and $1.50, provided by the 100-day MA, the upper angle of the triangle, and the 50-day MA. Beyond $1.50, further above lies $1.72 (bearish .5 Fib) resistance.
The RSI recently dipped beneath the midline again, indicating the bearish momentum might be starting to increase.
ADA/BTC – ADA Battles With 50-Day MA.
Key Support Levels: 4160 SAT, 4000 SAT, 3950 SAT.
Key Resistance Levels: 4200 SAT, 4400 SAT, 4740 SAT.
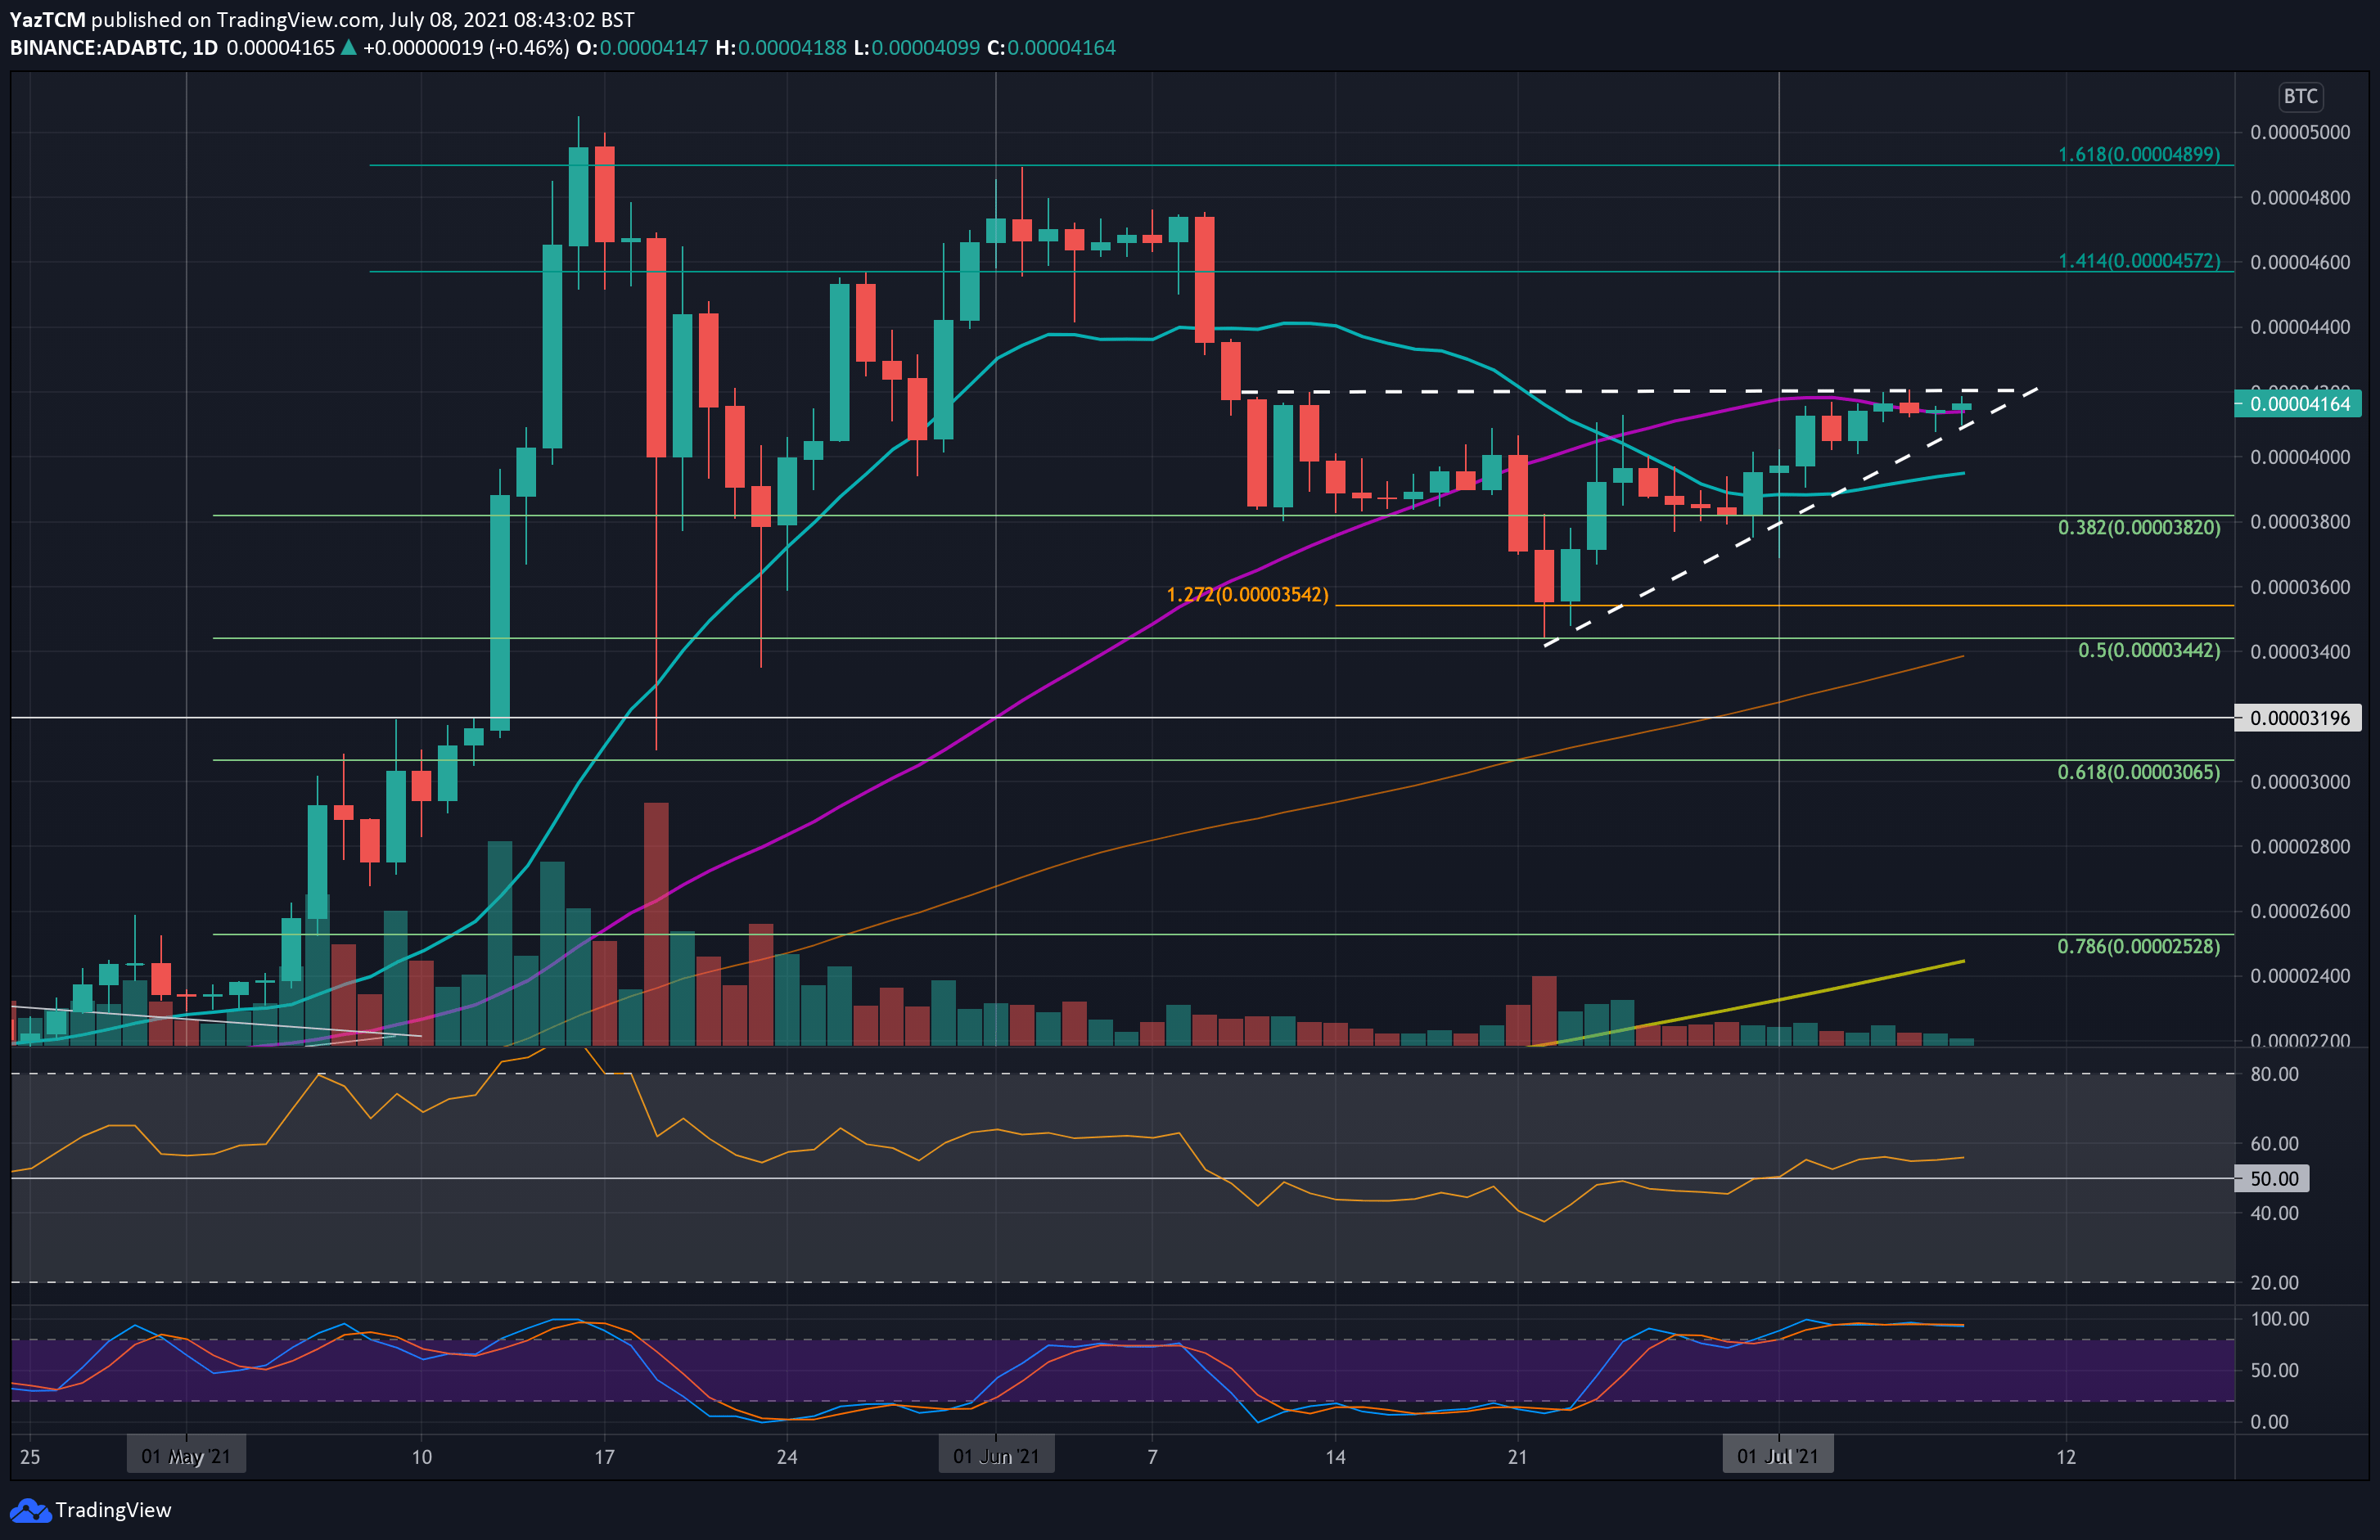
ADA is also trading inside an ascending triangle against bitcoin. Unlike the ADA/USD pair, ADA/BTC is currently battling to break the upper angle of the consolidation pattern and remain above the 50-day MA around 4160 SAT.
ADA/BTC rebounded from support at 3540 SAT at the end of June and established support at 3820 SAT. It bounced from there at the start of July to hit the upper angle of the triangle and the 50-day MA.
ADA-BTC Short Term Price Prediction
Moving forward, the first resistance lies at 4200 SAT (triangle’s upper angle). This is followed by 4400 SAT, 4740 SAT, and 4900 SAT (1.618 Fib Extension).
On the other side, the first support lies at 4160 SAT (50-day MA). This is followed by the triangle’s lower angle, 4000 SAT, and 3950 SAT (20-day MA). Further below – support lies at 3820 SAT (.382 Fib).
The RSI is above the midline here, indicating weak bullish momentum. For a positive breakout of the triangle, the RSI will need to rise to indicate increased bullish momentum.