Solana Price Analysis: SOL Trades Inside Price Channel Following Near 19% 7-Day Drop

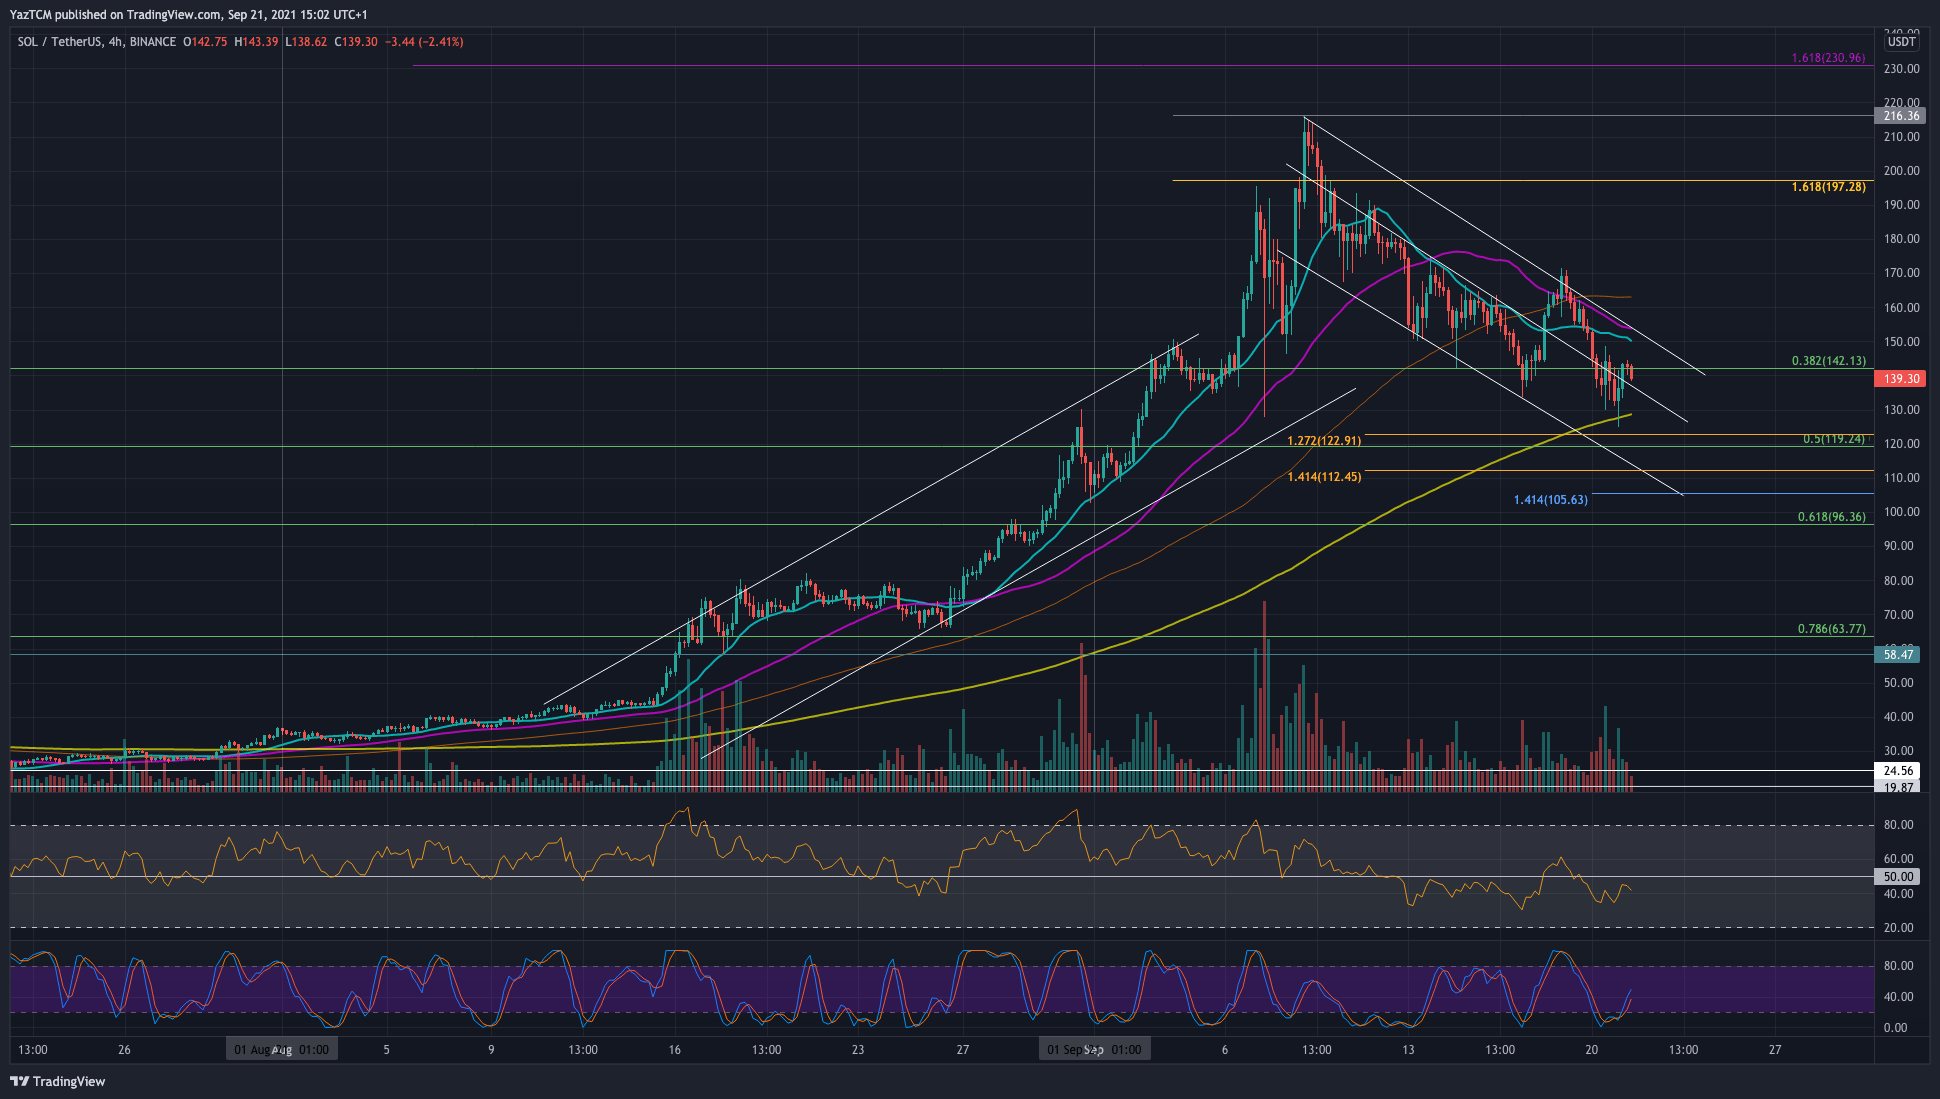
SOL/USD – SOL Heading Lower Inside Descending Price Channel.
Key Support Levels: $130, $123, $121.
Key Resistance Levels: $150, $160, $180.
SOL is down a sharp 18.5% this week as it continues to trend lower inside a descending price channel. It managed to set a new ATH price in the first week of September at $216. Since then, SOL rolled over to form the falling price channel.
On Saturday, the cryptocurrency attempted to break the upper angle of the price channel but failed to go above $170. During the capitulation yesterday, SOL fell as low as $130 but has since rebounded to $135.
For SOL to continue the upward trend it established over the past month, it would need to break above the price channel and clear $160 (20-day MA).

SOL-USD Short Term Price Prediction
Looking ahead, the first strong resistance lies at $150 (upper angle of the price channel). This is followed by $160 (20-day MA), $180, and $200 (1.618 Fib Extnesion).
On the other side, the first support lies at $130. This is followed by $123 (downside 1.272 Fib Extension), $121 (.5 Fib Retracement), and $112 (downside 1.414 Fib Extension), and $100 (50-day MA).
The daily RSI is right at the midline, indicating indecision within the market. However, the 40hour RSI is beneath the midline.
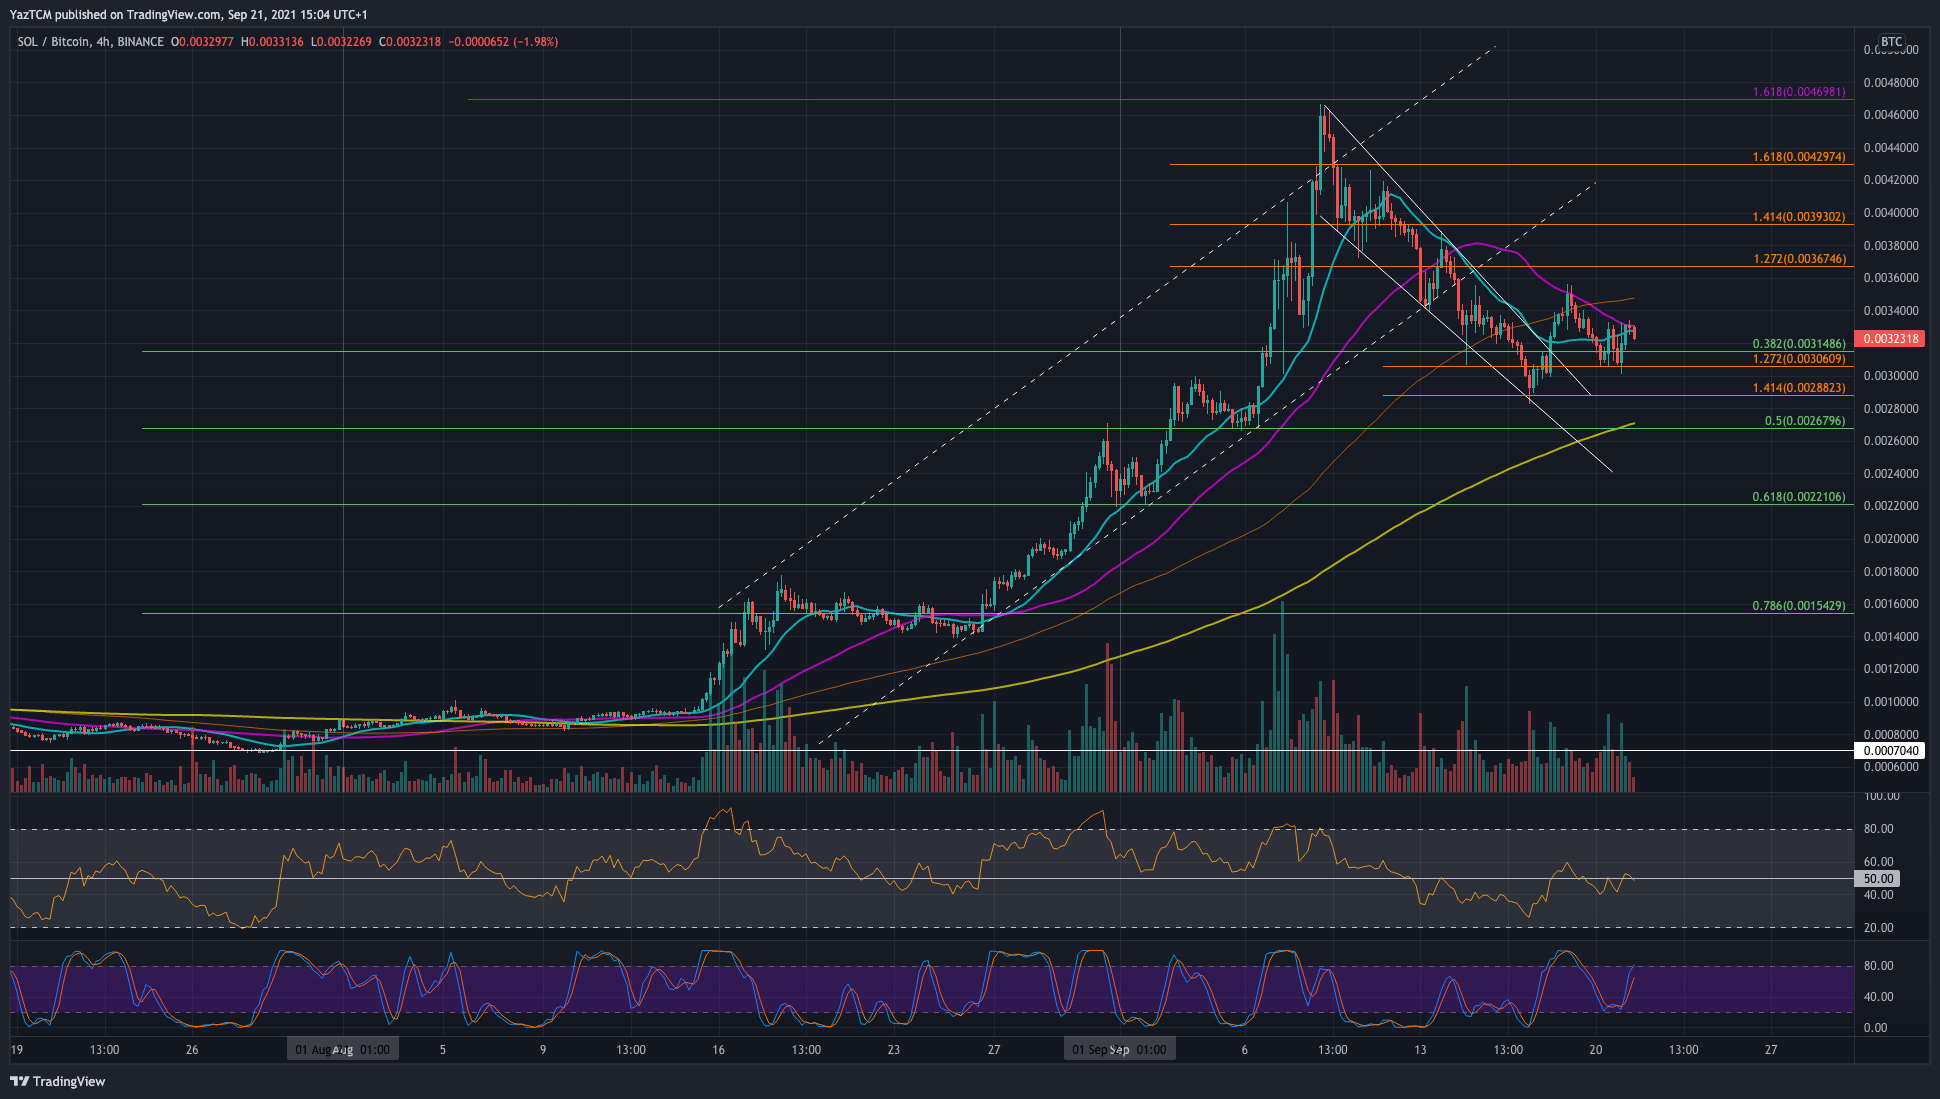
SOL/BTC – Bulls Rebound From 0.003 BTC Support.
Key Support Levels: 0.00315 BTC, 0.003 BTC, 0.00288 BTC.
Key Resistance Levels: 0.0035 BTC, 0.00367 BTC, 0.004 BTC.
SOL is also heading lower against BTC, but the bulls are battling to hold the support at around 0.00306 BTC (1.272 Fib Extension). The market formed a bearish wedge over the past week, which caused SOL to fall as low as 0.00288 BTC (downside 1.414 Fib Extension).
The buyers managed to break toward the upside of the wedge over the weekend but failed to overcome resistance at 0.0035 BTC. The market has now returned to the 0.00305 BTC support, which is crucial to defend.

SOL-BTC Short Term Price Prediction
Looking ahead, the first support lies at 0.00315 BTC (.382 Fib). This is followed by 0.003 BTC, 0.00288 BTC, and 0.00267 BTC (.5 Fib).
On the other side, the first resistance lies at 0.0035 BTC (20-day MA). This is followed by 0.00367 BTC (1.272 Fib Extension), 0.004 BTC (1.414 Fib Extension), and 0.0043 BTC (1.618 Fib Extension).
The daily RSI is still above the midline here, indicating that the bulls still weakly control the market momentum.


