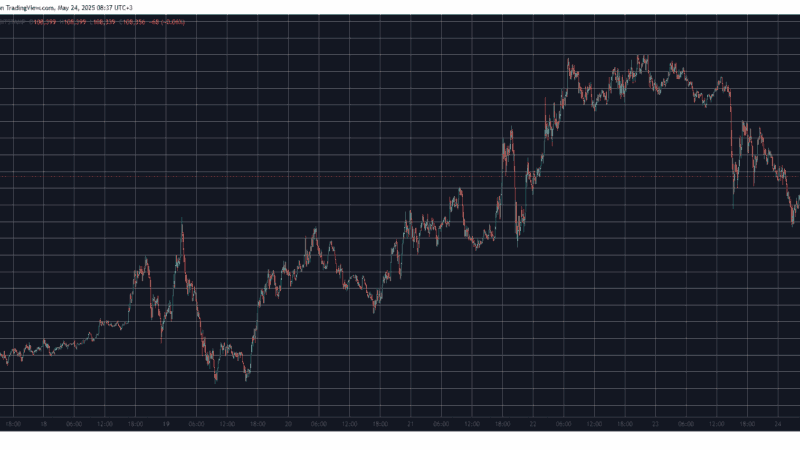
Bitcoin Price Analysis: BTC Soars Above Short-term Key Resistance, $50k Incoming?

Bitcoin has been outperforming global stocks even in a risk-off environment as investors have been waiting to see if support at $40k would hold. Today’s strong rally could be the beginning of the next leg up for the primary cryptocurrency after a month-long shake out full of liquidations and FUD, mainly from China.
As we reported this week, the 4-hour chart began to show flattening of near-term moving averages, a sign of consolidation making progress, potentially setting up for a breakout attempt.
BTC continued to make higher lows and began to test the rising trend line at $44k. Within hours, BTC pushed higher testing the next key resistance levels at $44.3k and $45.1k.
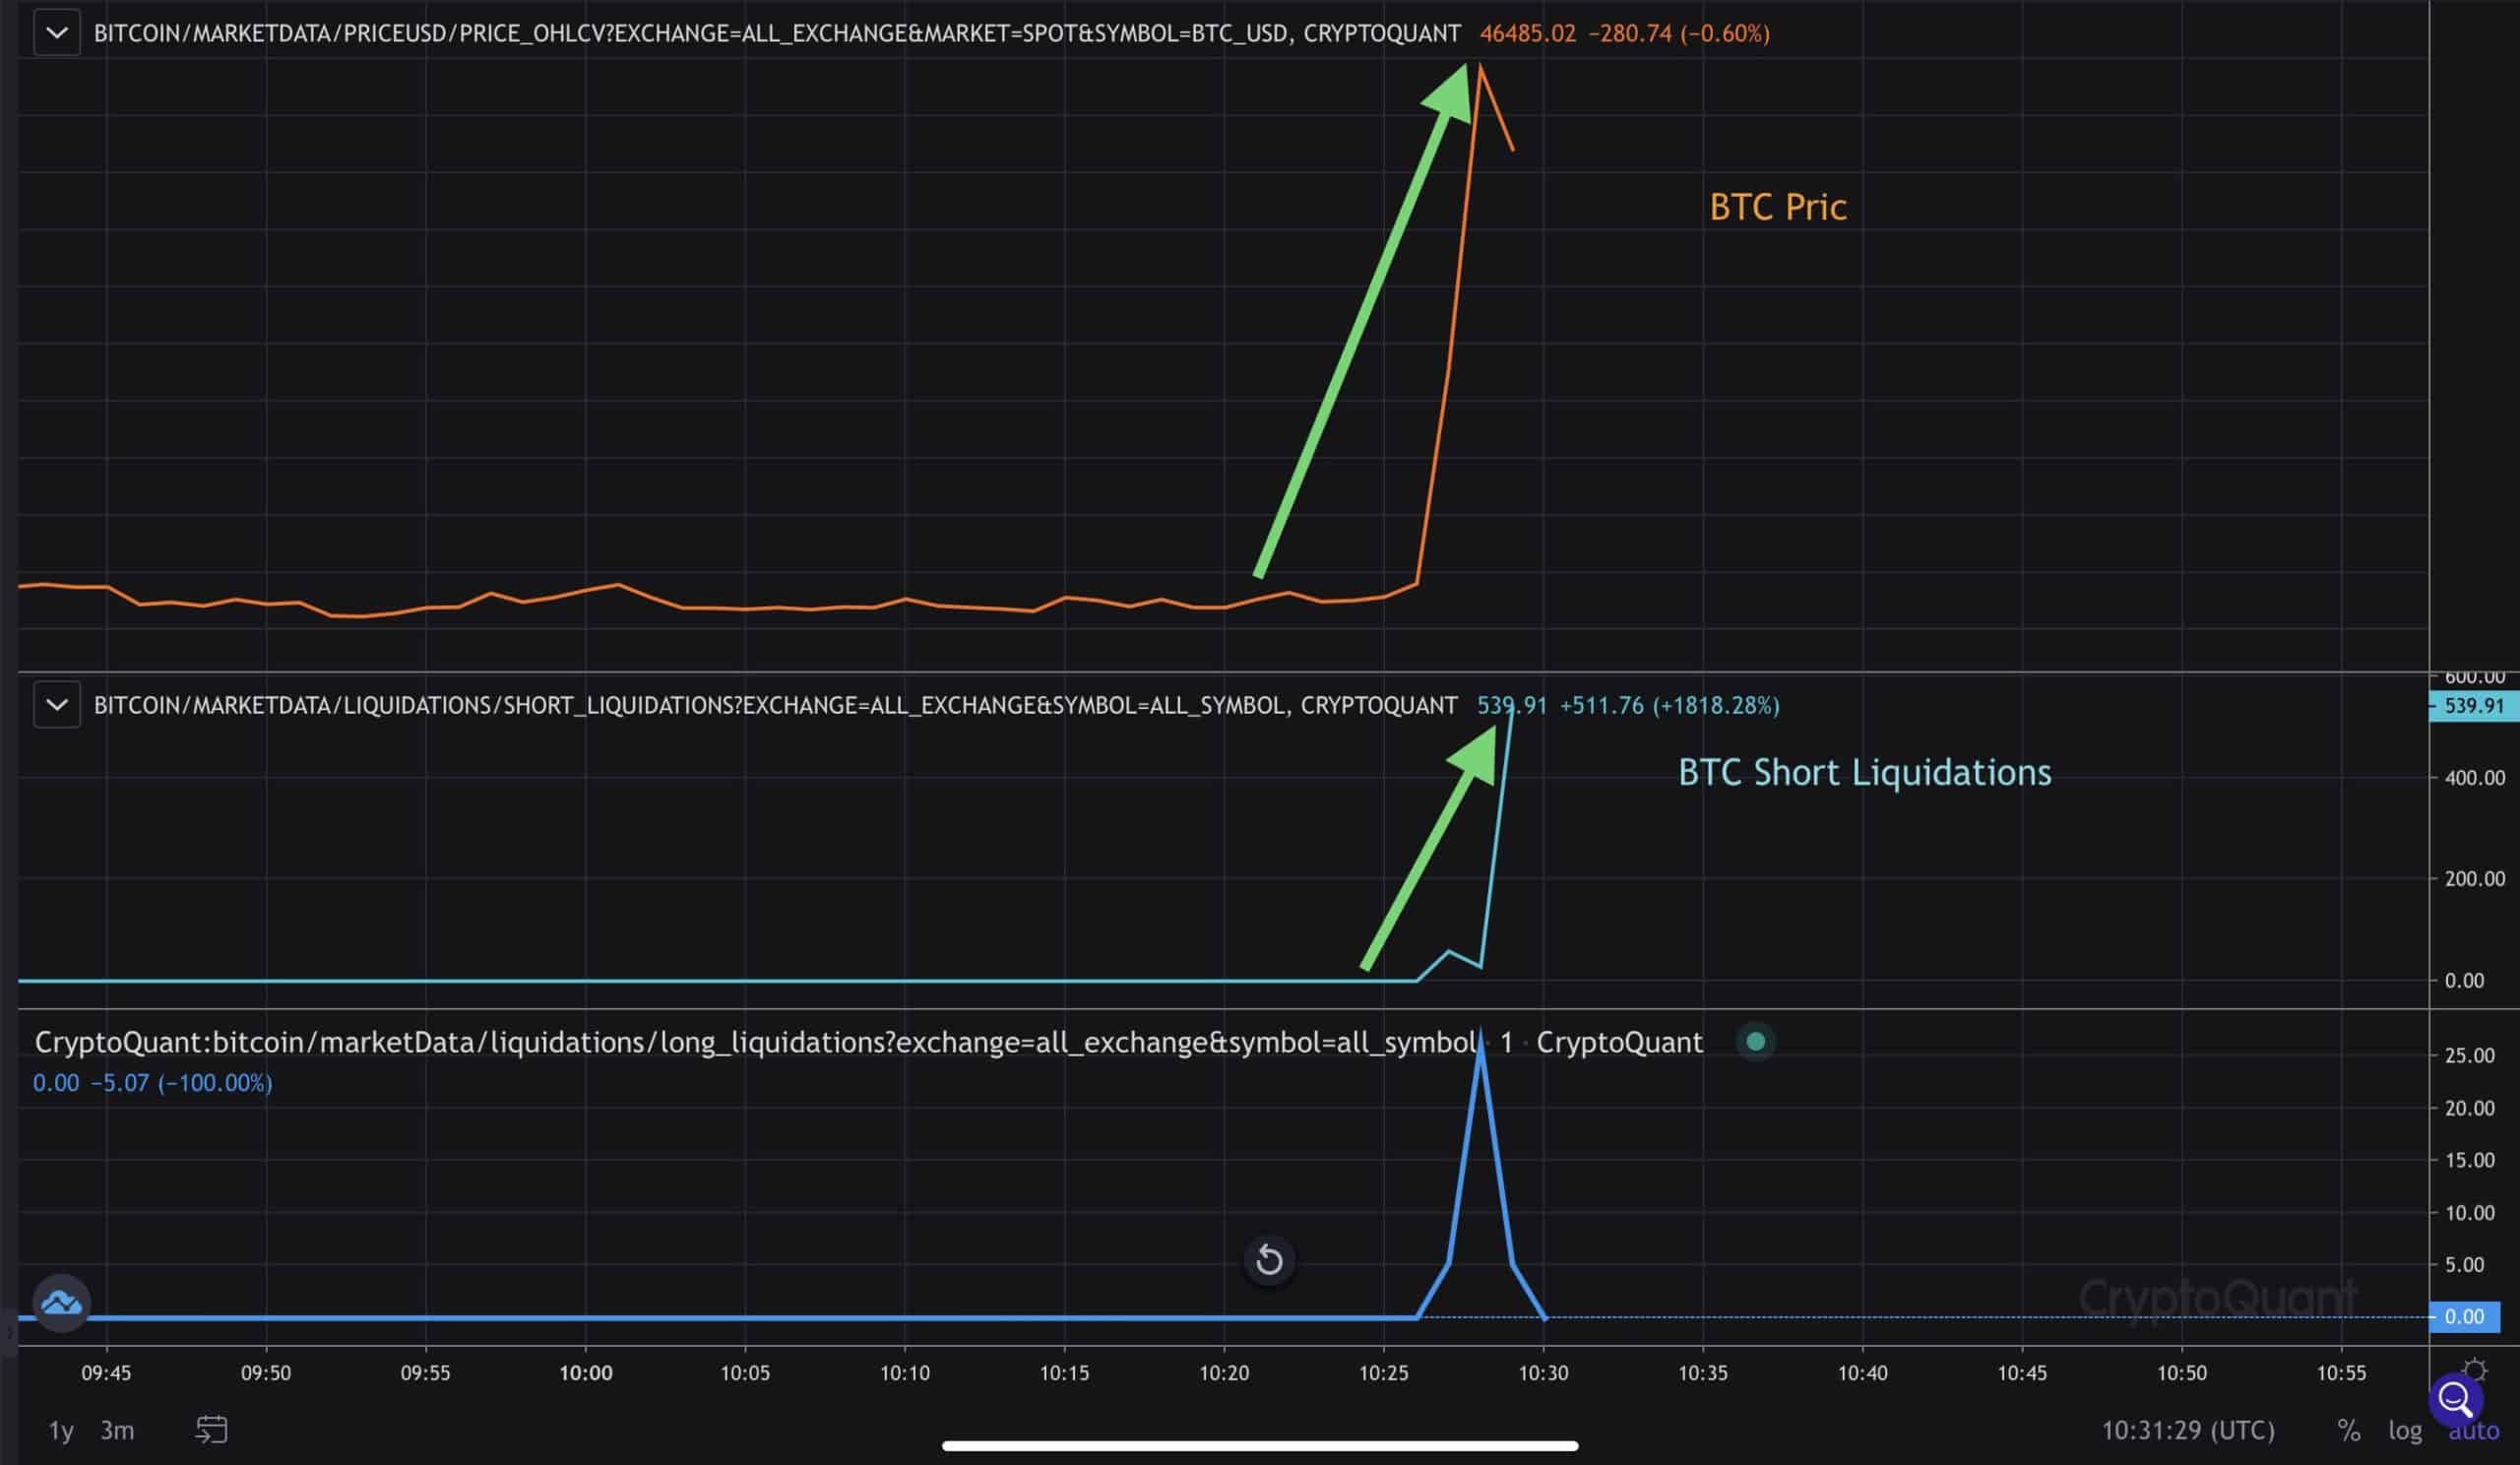
BTC soared as shorts were squeezed out of their positions, as an incredible 539 BTC shorts were liquidated in just one minute, sending BTC to $47k. As of now, BTC’s rally hit an intraday high above $48k, forming a higher high, further suggesting the Wave 2 correction likely completed.
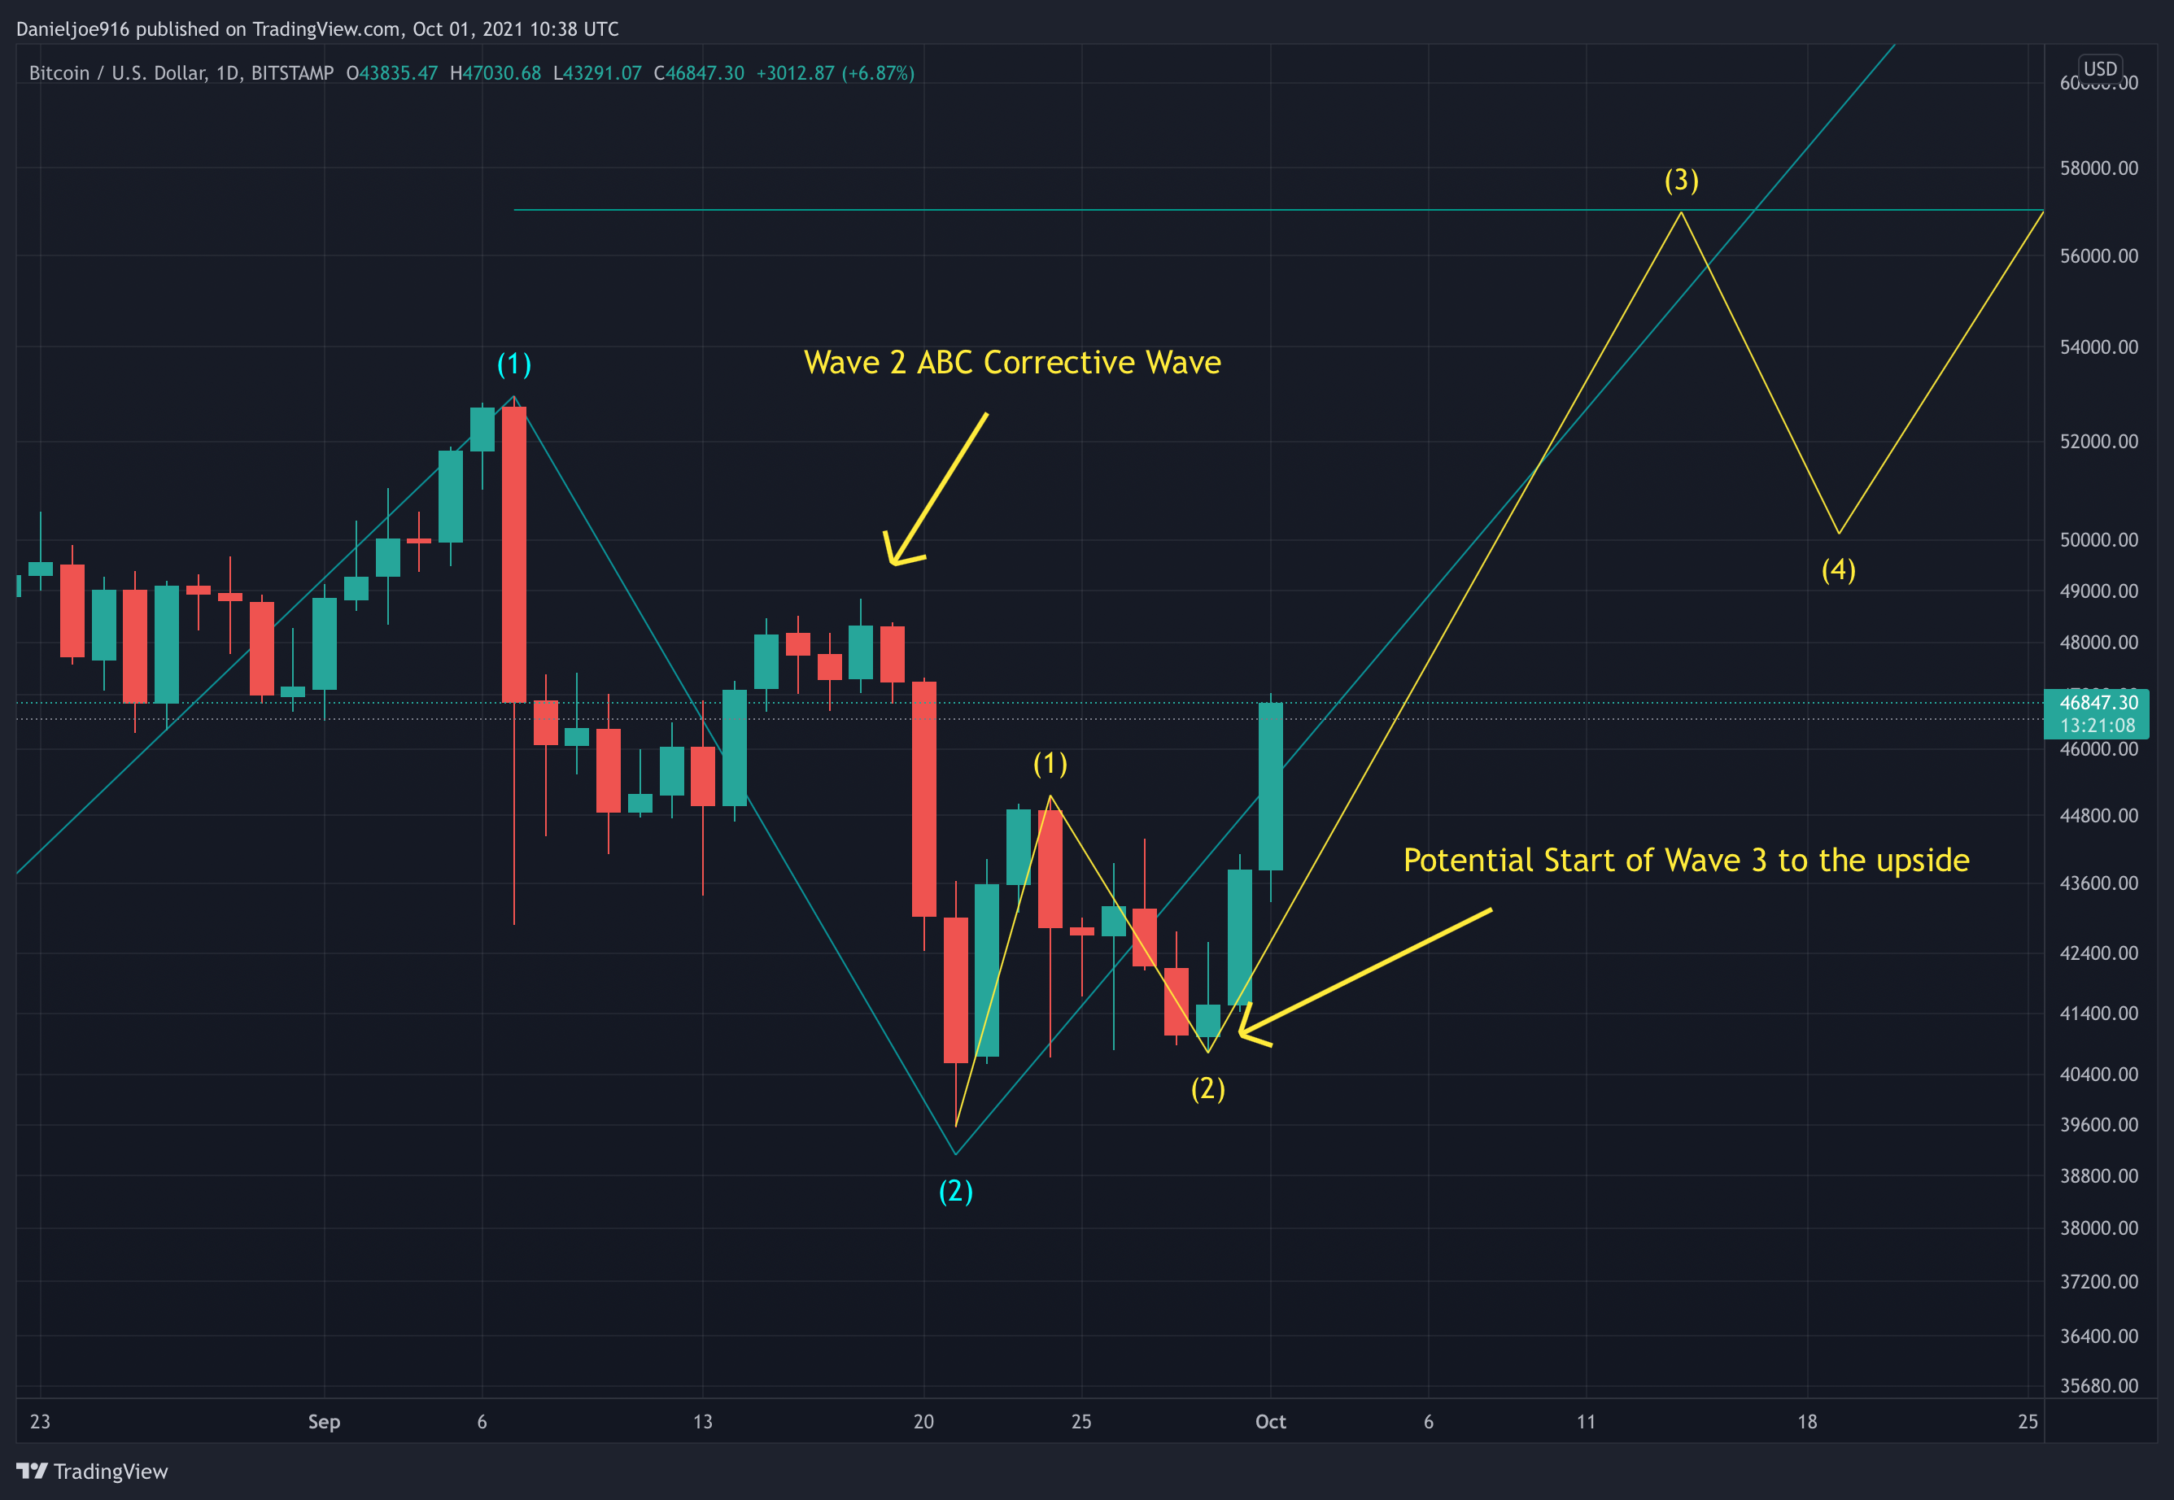
If the higher low at $40.7k was indeed Wave 2, the recent price action above $45.2k suggests BTC is entering Wave 3, which is the most significant move to the upside. Given these Elliot Waves are smaller relative to the larger wave counts, this bullish move could be the beginning of a strong impulse higher, possibly sending BTC back toward the all-time high area – amid the $65k region.
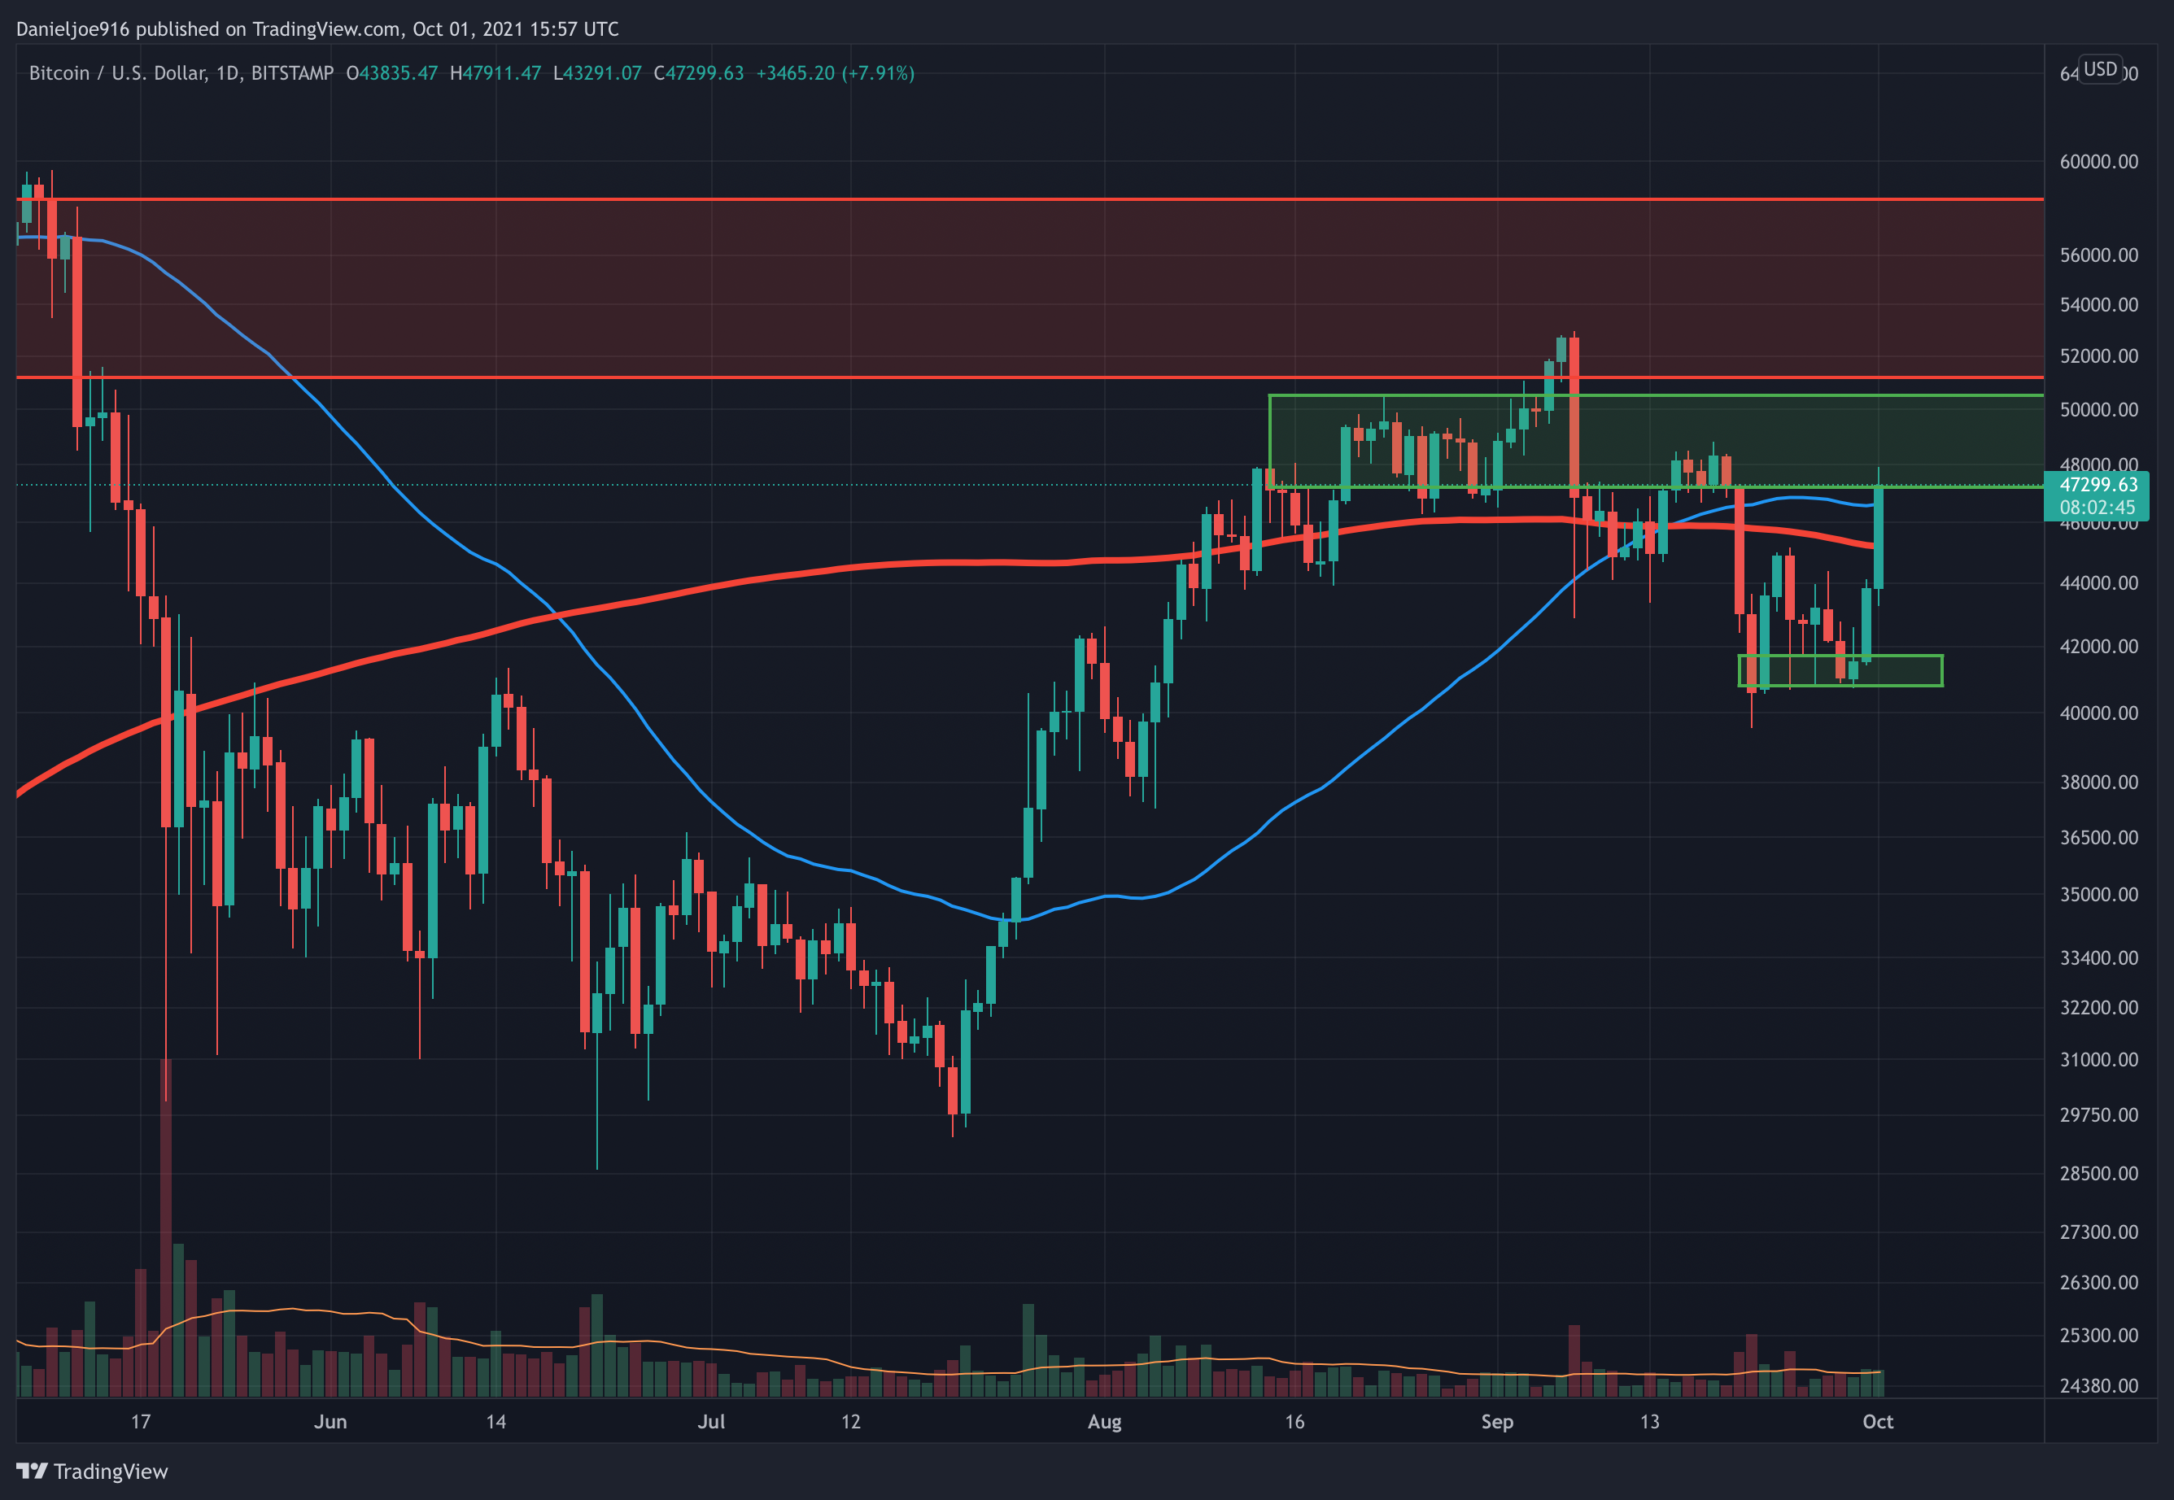
It is important to wait for the daily close (midnight UTC) to see if the bitcoin price can hold onto the gains. It is critical to close above $45.2k, to form a higher high. At the time of writing, BTC is also intraday above the 200-day moving average and the 21-week EMA, two critical levels in determining bull market continuation.
Reclaiming the 200-day moving average and 21-week EMA on a weekly closing basis will be a very bullish signal.
On-chain Was Bullish at $40.7k
As FUD and risk-off shook the market, BTC on-chain metrics continued to show a bullish trend firmly. Throughout the 55% drawdown in May, continuing liquidation events, and FUD, the long-term holders, and miners have continued to accumulate. This behavior matches previous Bitcoin bull markets, especially the 2013 bull market where long-term holders and miners continued to accumulate.
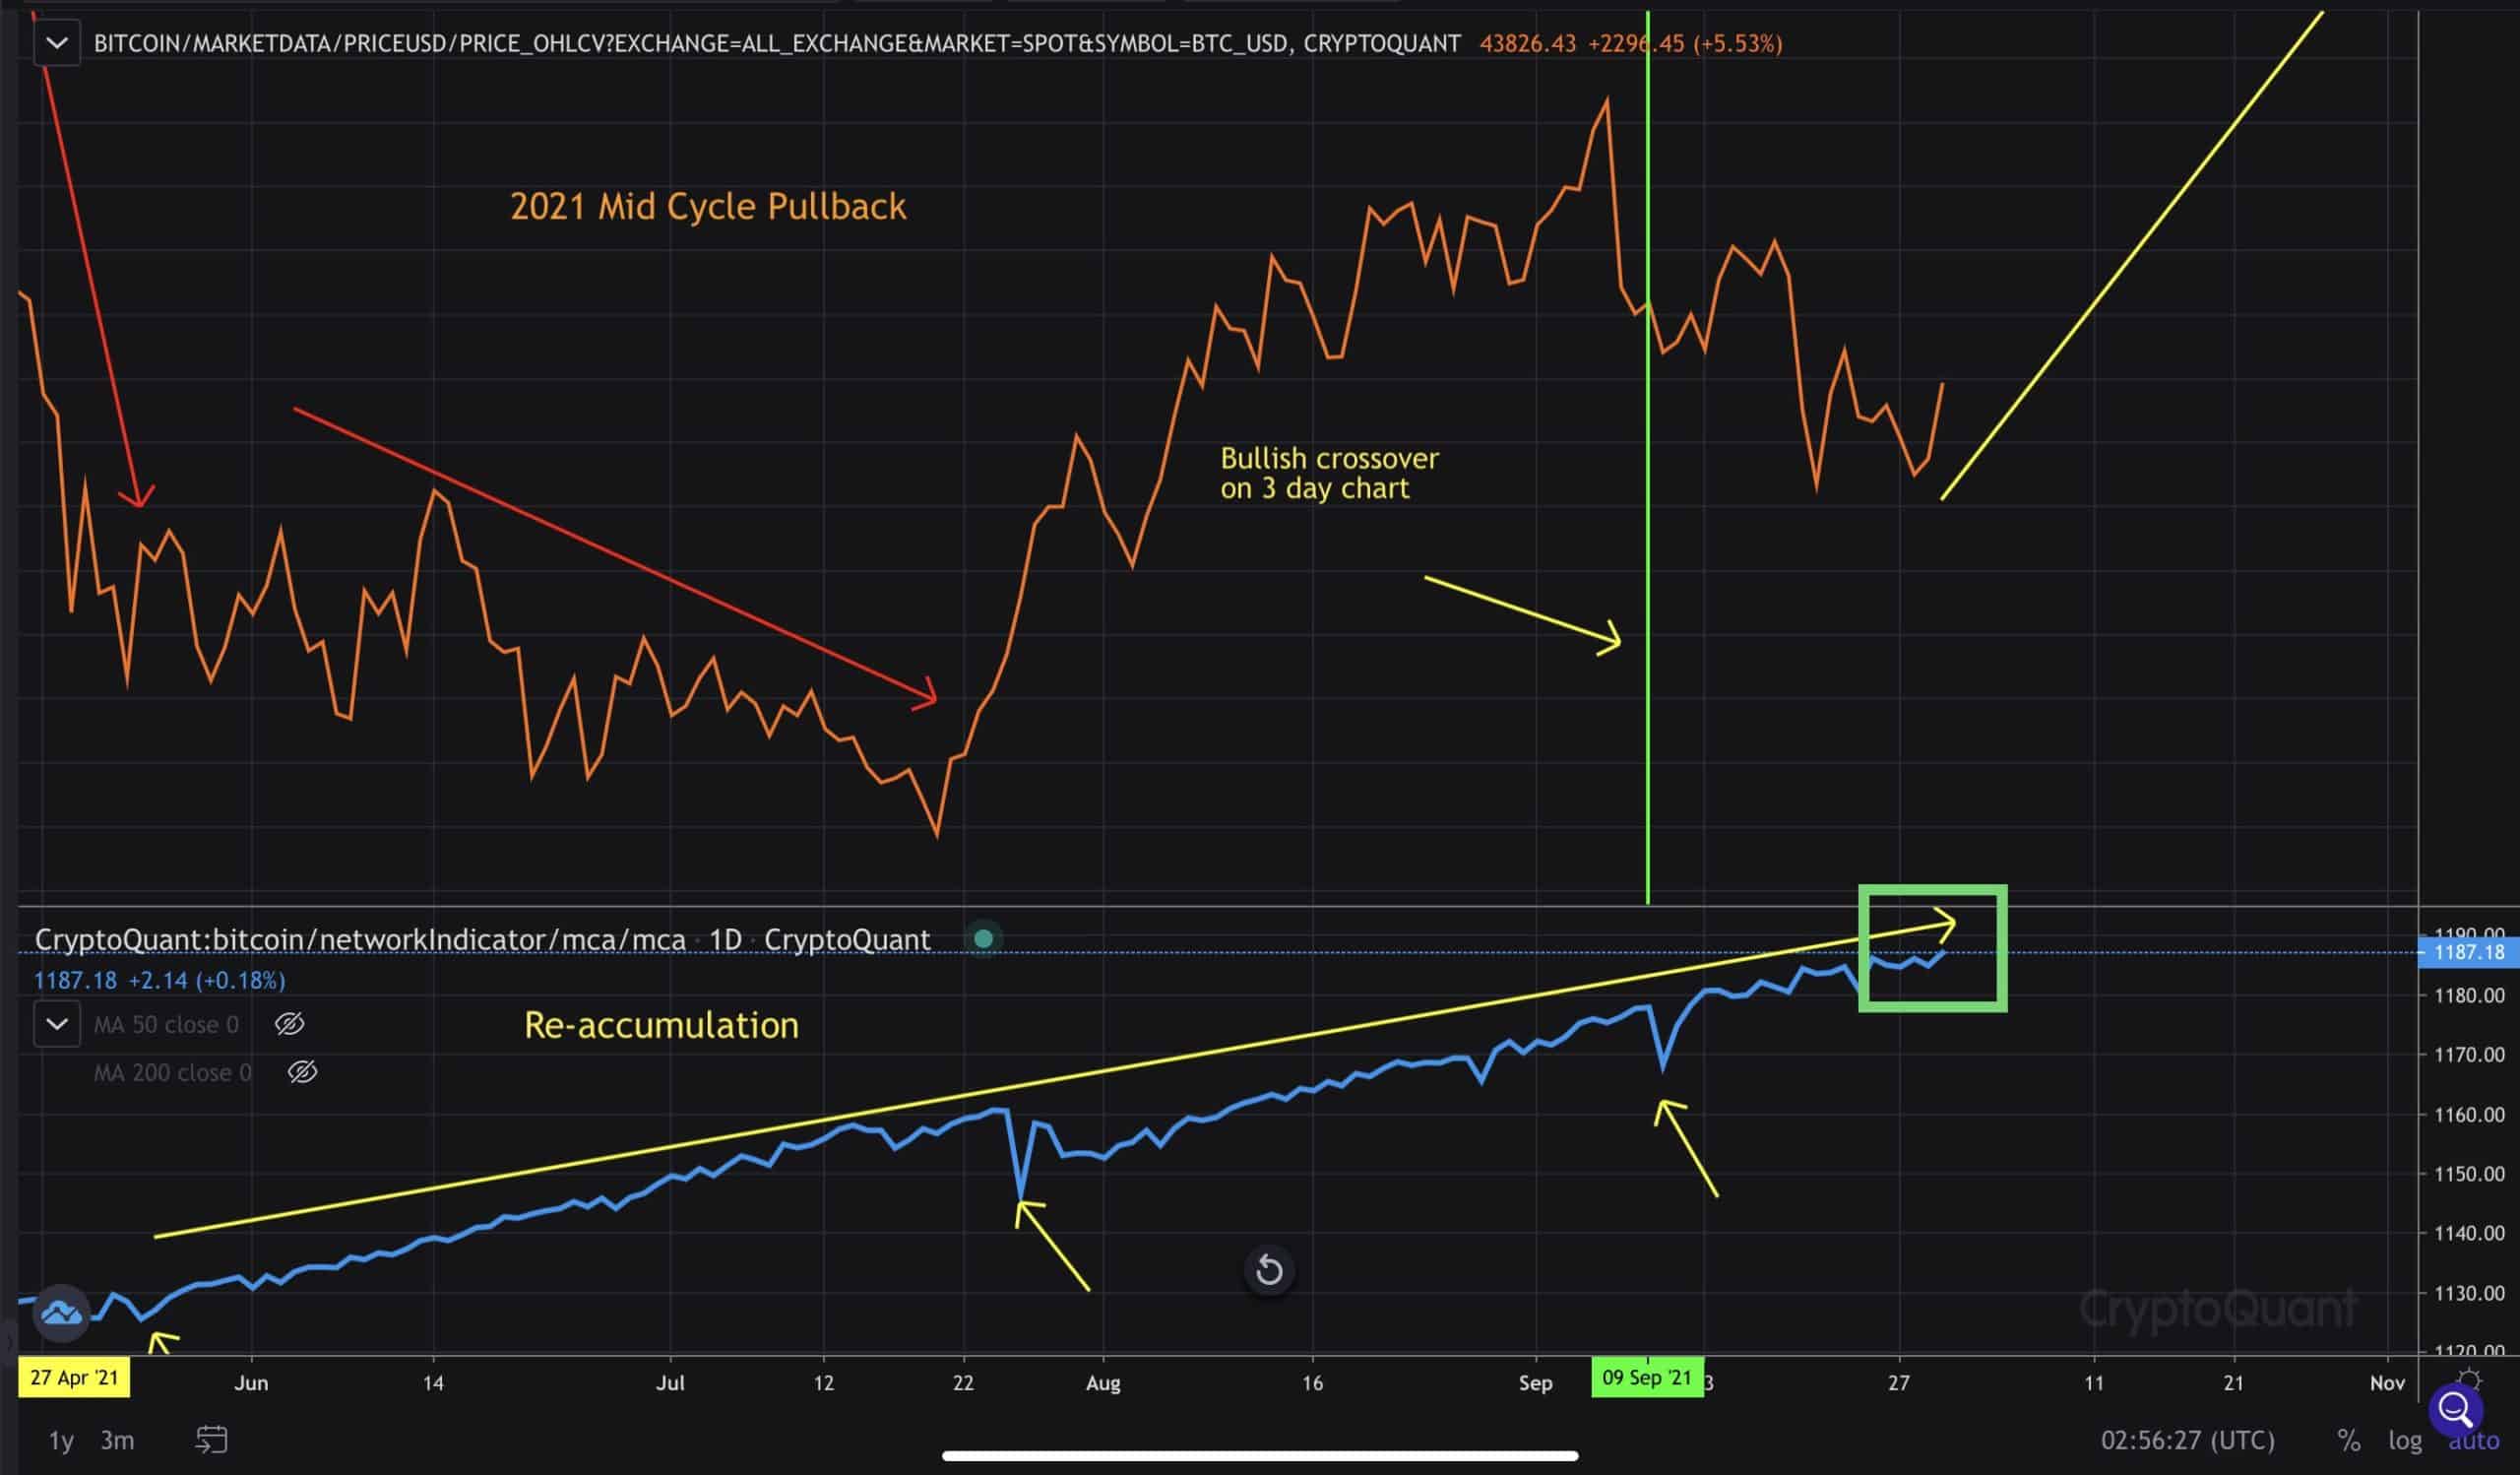
Unlike bear markets, where long-term holders and miners aggressively distribute after parabolic blow-off tops and bull traps, this year May’s 55% crash did not lead to further distribution by these cohorts. This trend clearly invalidates the bear thesis as all bear markets saw aggressive distribution from long-term holders and miners.
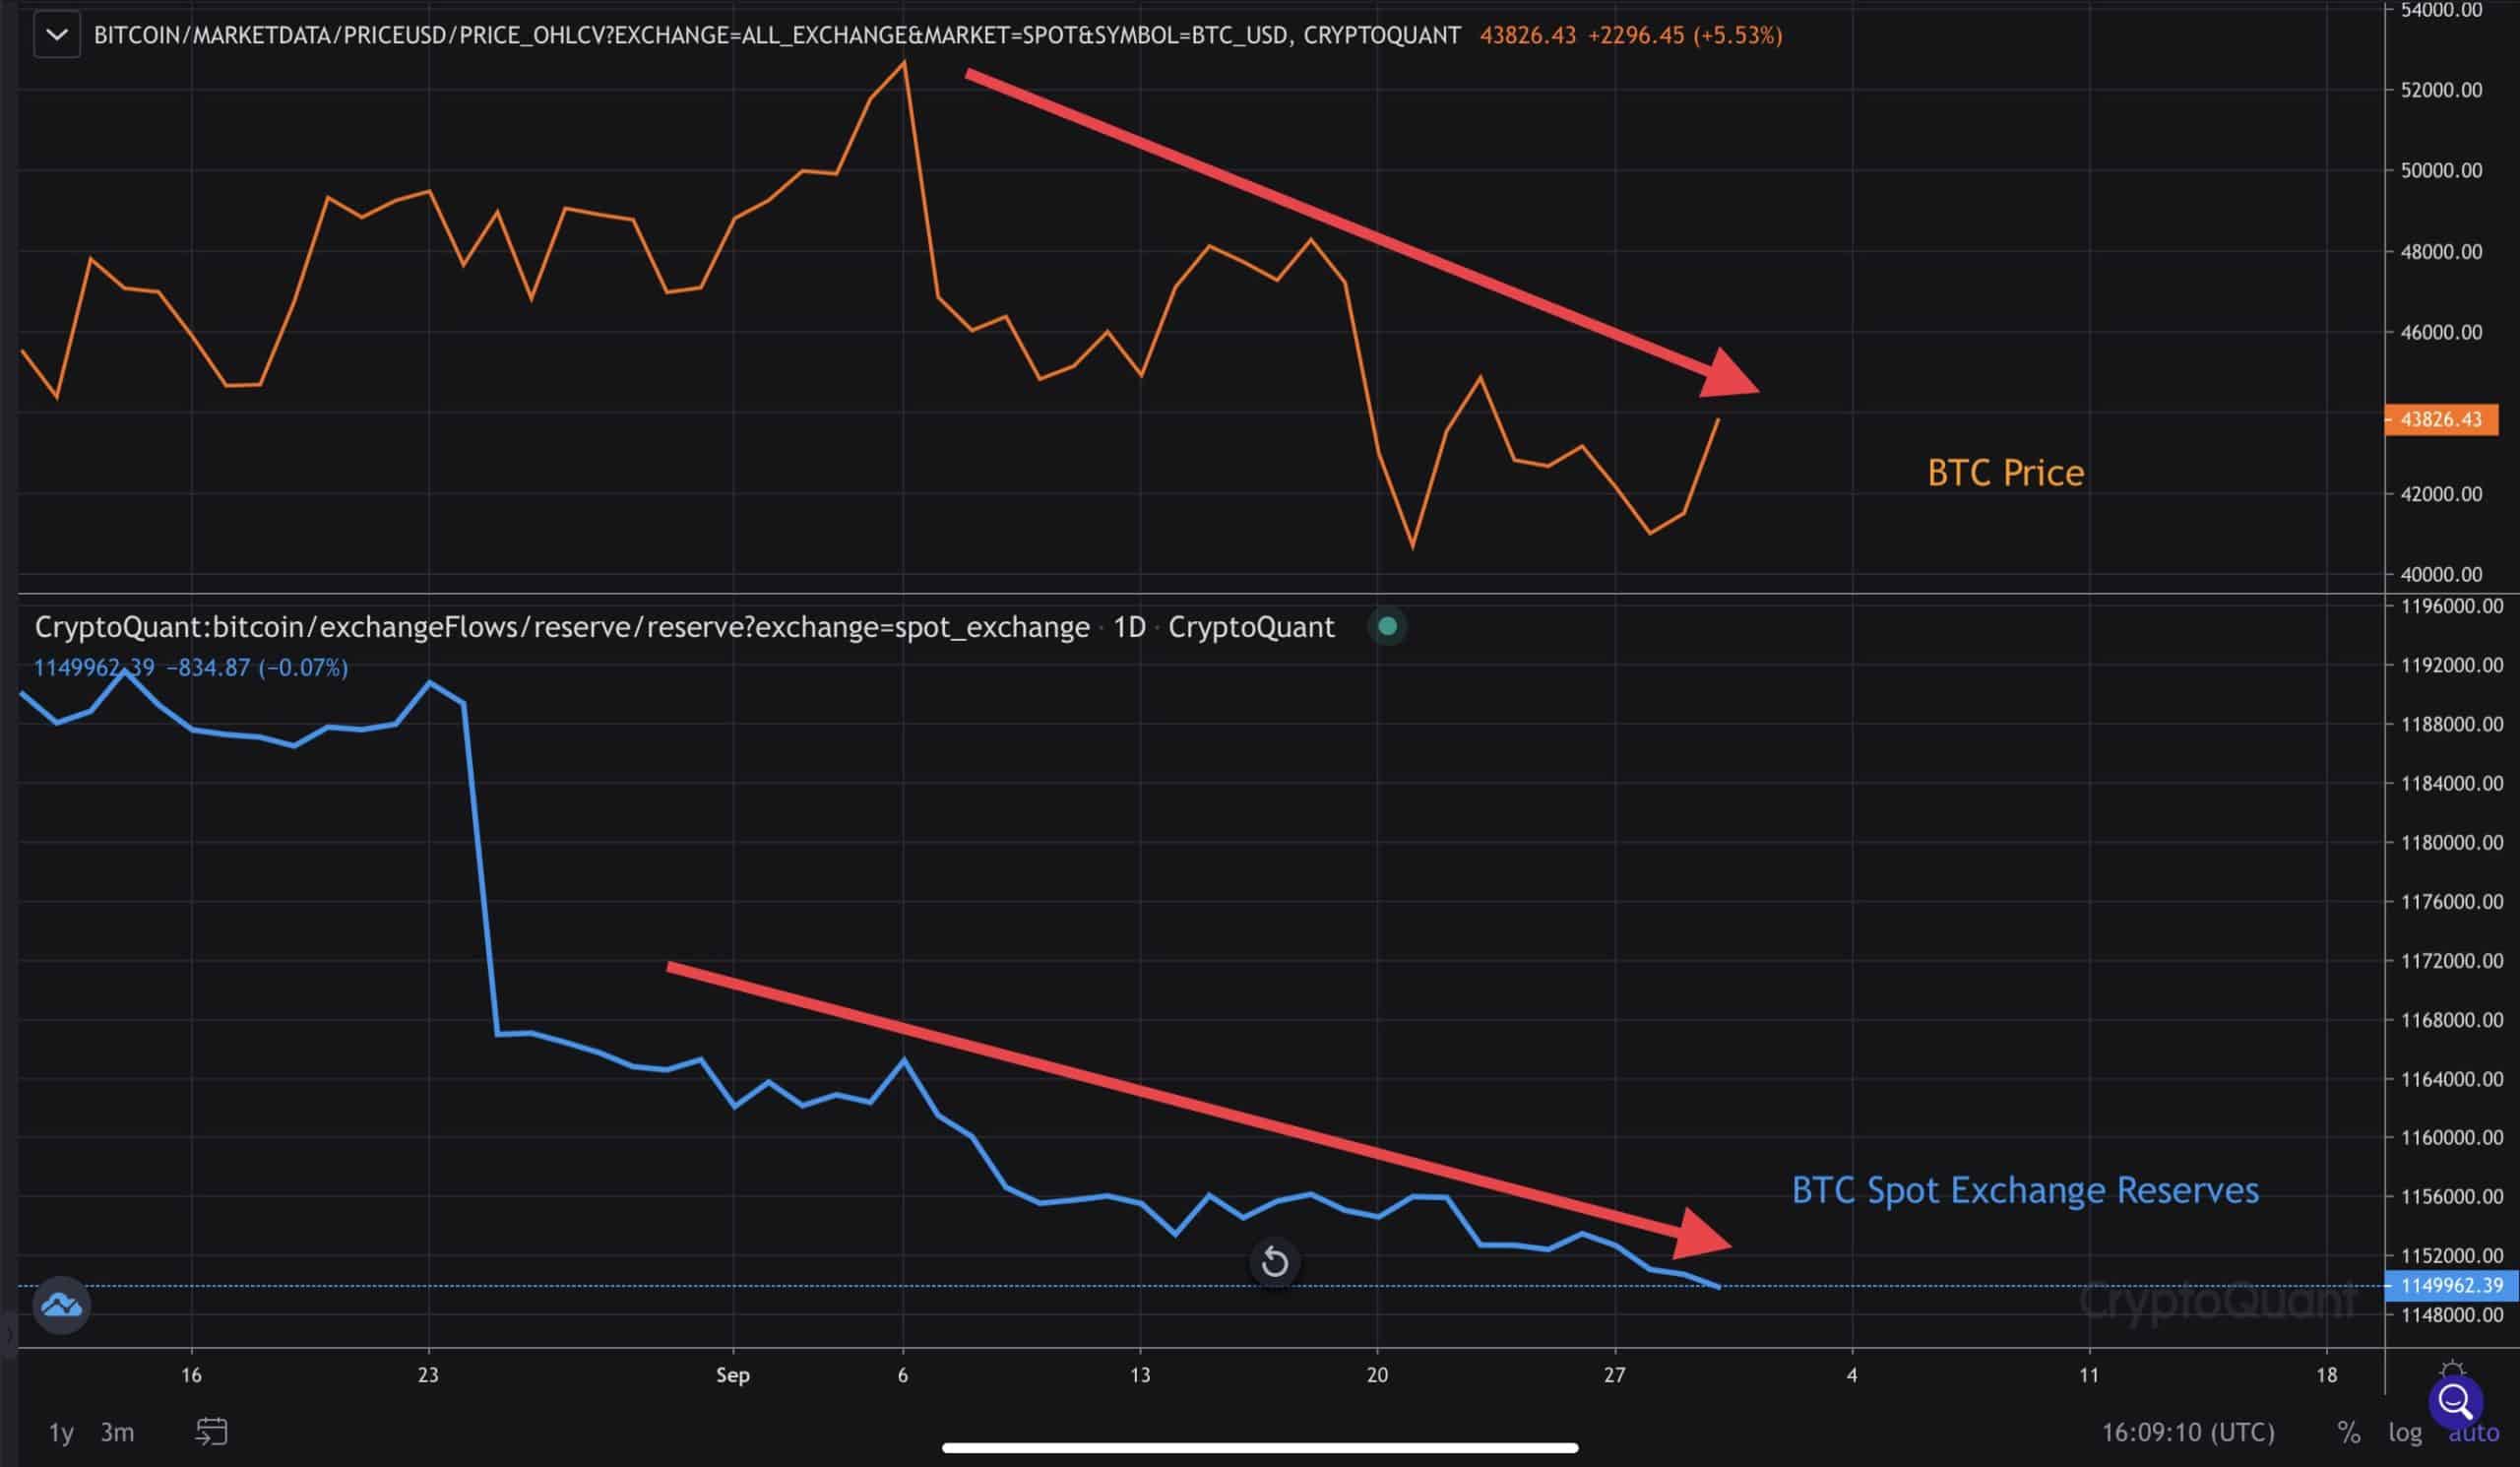
For the past few days, spot exchange reserves have continued to trend lower even as global markets sold off and the dollar rallied. CryptoQuant’s UTXO Age Distribution showed younger coins continued to sell while the older coins accumulated. Spot exchanges are down more than 15,000 BTC during the 3-week pullback, a strong signal of accumulation.
Incoming Bullish Move?
With near-term technicals showing significant improvement, a firmly bullish on-chain trend, and divergence from global stocks, BTC looks well-positioned for significant upside if we continue to see substantial accumulation and price follow-through higher.
At the moment, the bulls have once again regained control. The weekly close will give further validation of the recent move higher. All eyes will be on $45.2k to confirm a higher high.

