ETH Price Analysis: Ethereum Down 5% Daily but is a Reversal in Play?
Ethereum experienced a sudden collapse and lost 10% of its value. This led to the cryptocurrency trading at its lowest point against Bitcoin since October last year.
Technical Analysis
By Grizzly
The Daily Chart
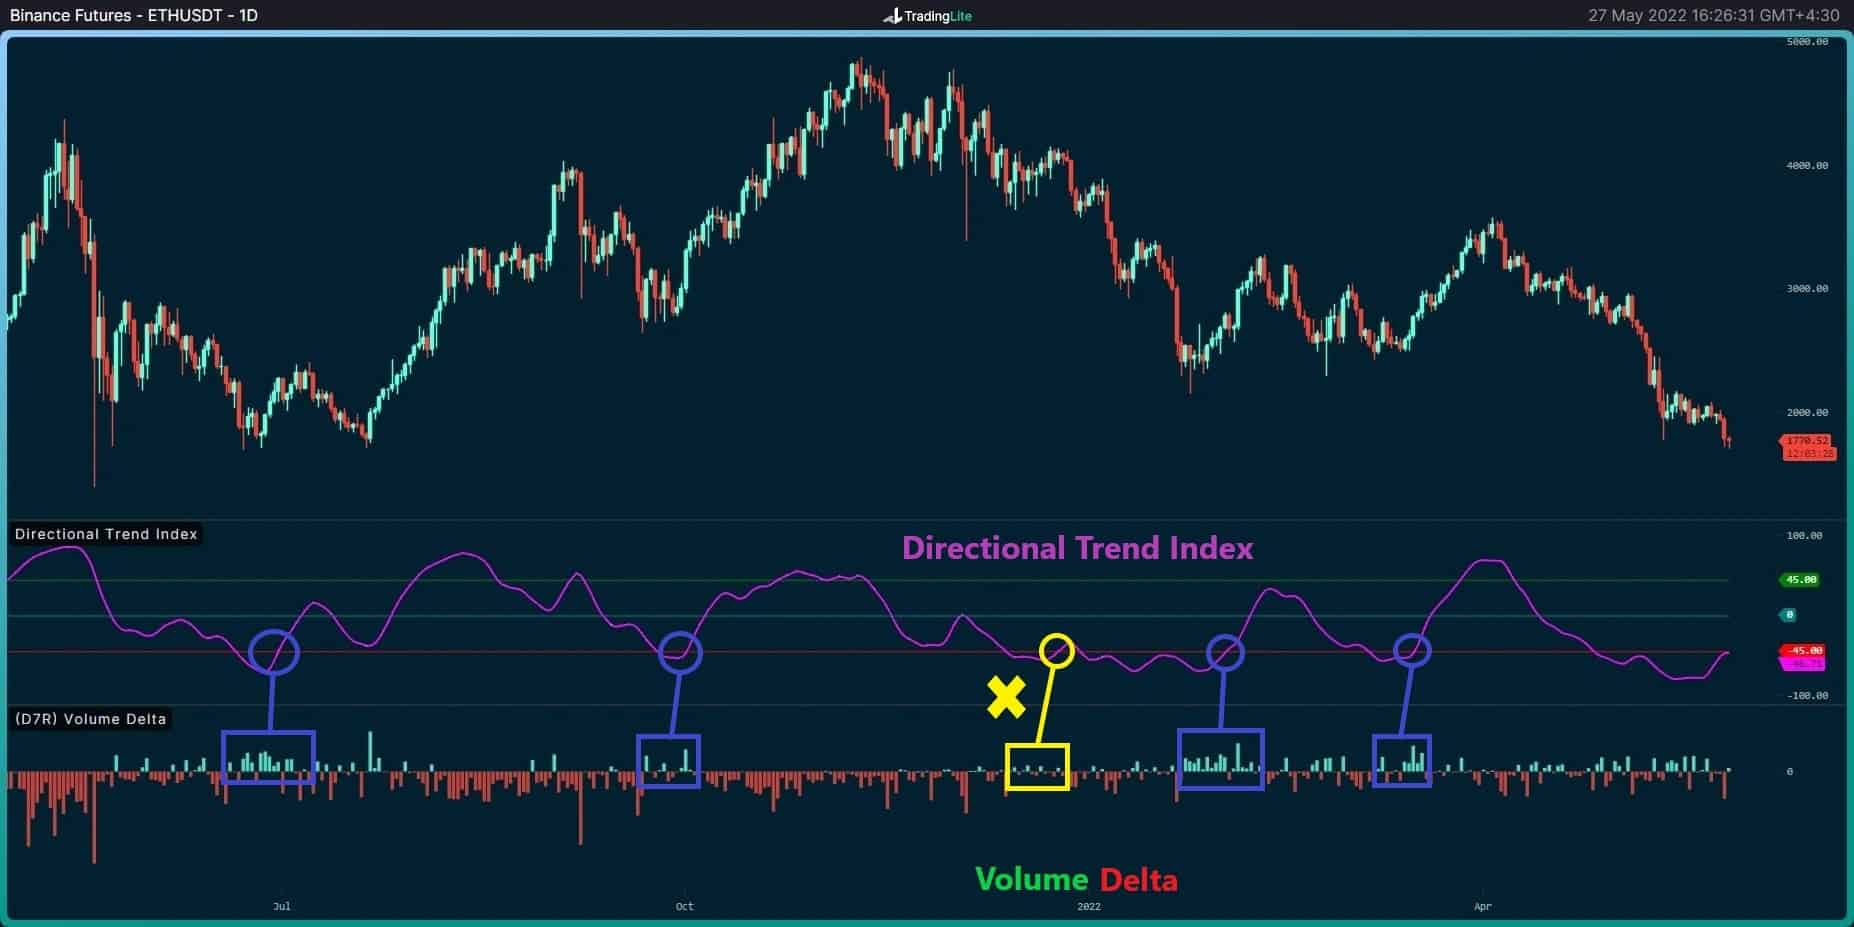
As the blue rectangle is shown in the Binance-Futures chart – since the first ATH, all uptrends have been accompanied by an increase in the Volume Delta. This confluence indicates that the dominance of the takers-buy (aggressive buyers) orders in the futures market could be a reliable signal for a trend reversal. Moreover, the mentioned signal can also be reverified by the Directional Trend Index (DTI) – this verification method failed in only one case (yellow box).
Currently, the DTI is about to break the red line signaling a potential reversal. The taker-buy side has also dominated the market in the last two weeks.
Suppose traders push the price towards the static support at $1700. In that case, the buying intensity would determine the market’s sentiment in the longer term. The $1700 level has played an essential role as a static support level over the past year. Therefore, its failure is likely to cause more panic in the market.
Key Support Levels: $1700 & $1500
Key Resistance Levels: $2200 & $2450

Moving Averages:
MA20: $2042
MA50: $2588
MA100: $2748
MA200: $3197
The ETH/BTC Chart
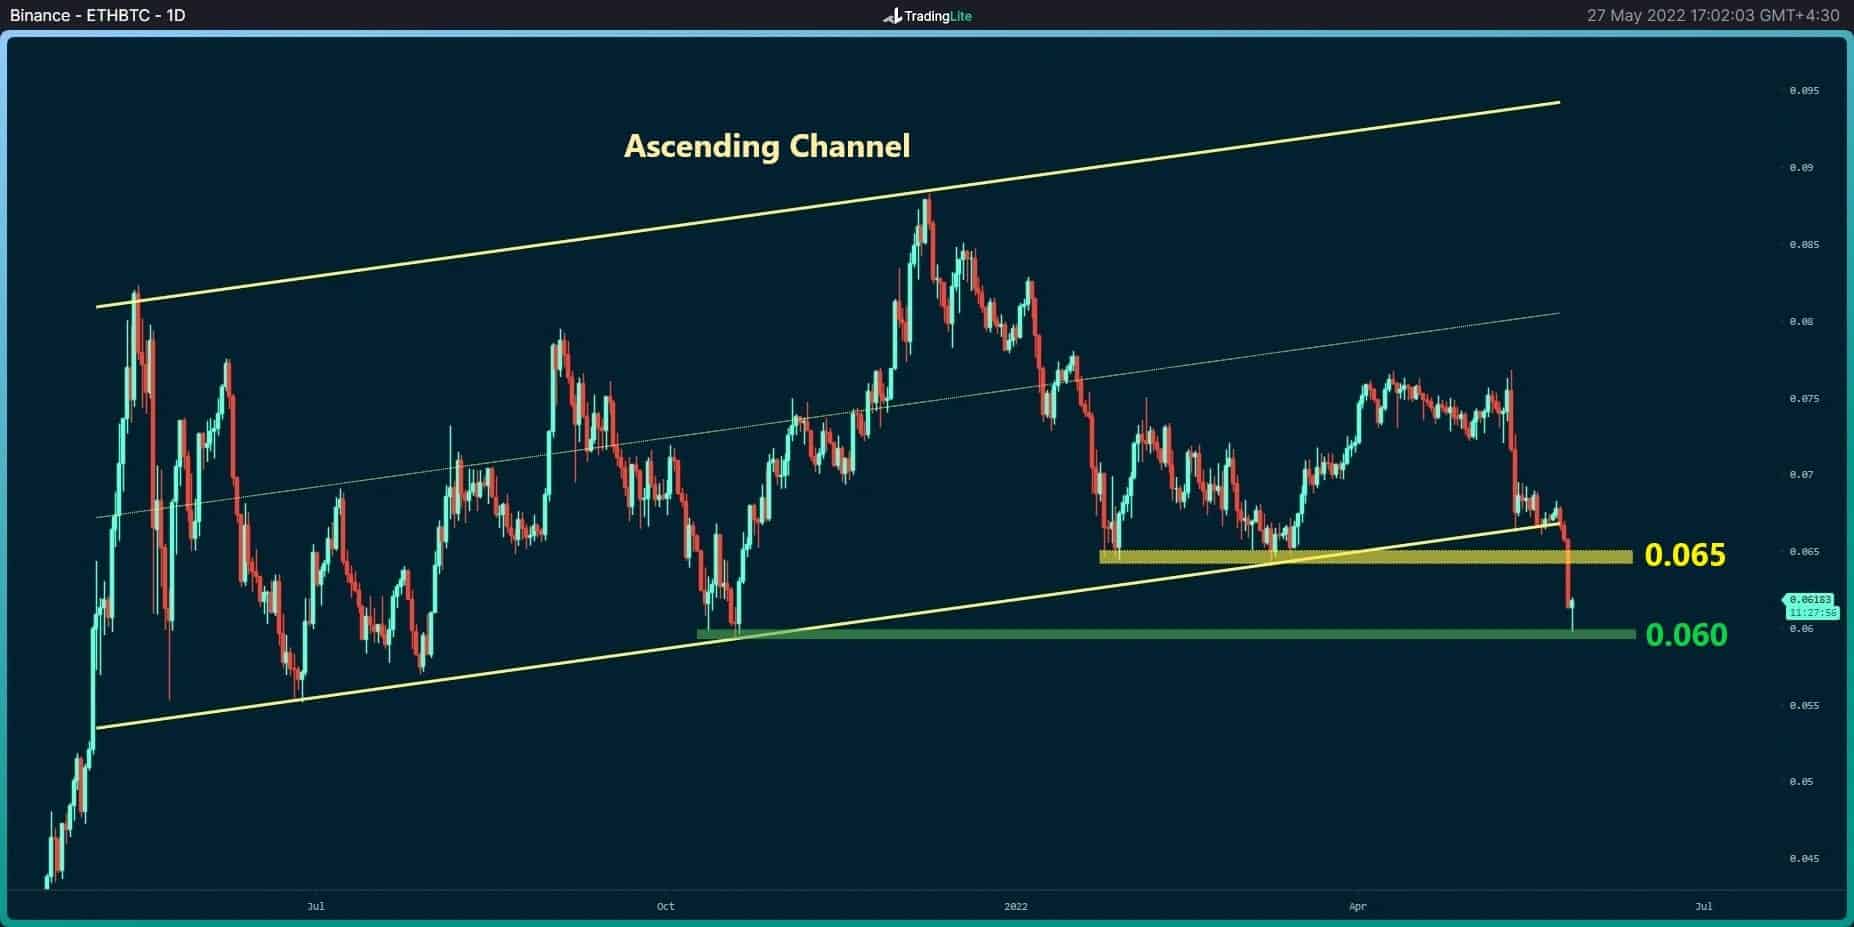
Against BTC, ETH finally lost the ascending channel and broke down the static level of 0.065 with strength. The horizontal support at 0.06 is currently able to prevent further price drops.
The bulls must push the price above the yellow zone. Otherwise, any move can be considered a bearish bounce and the decline may continue.
Key Support Levels: 0.060 BTC & 0.055 BTC
Key Resistance Levels: 0.065 BTC & 0.070 BTC
On-chain Analysis
Exchange Netflow (Total)
Definition: The difference between coins flowing into and out of the exchange. (Inflow – Outflow = Netflow). A positive value indicates the reserve is increasing. A high value indicates increasing selling pressure on spot exchanges, which usually translates to increased volatility on derivative exchanges as well.
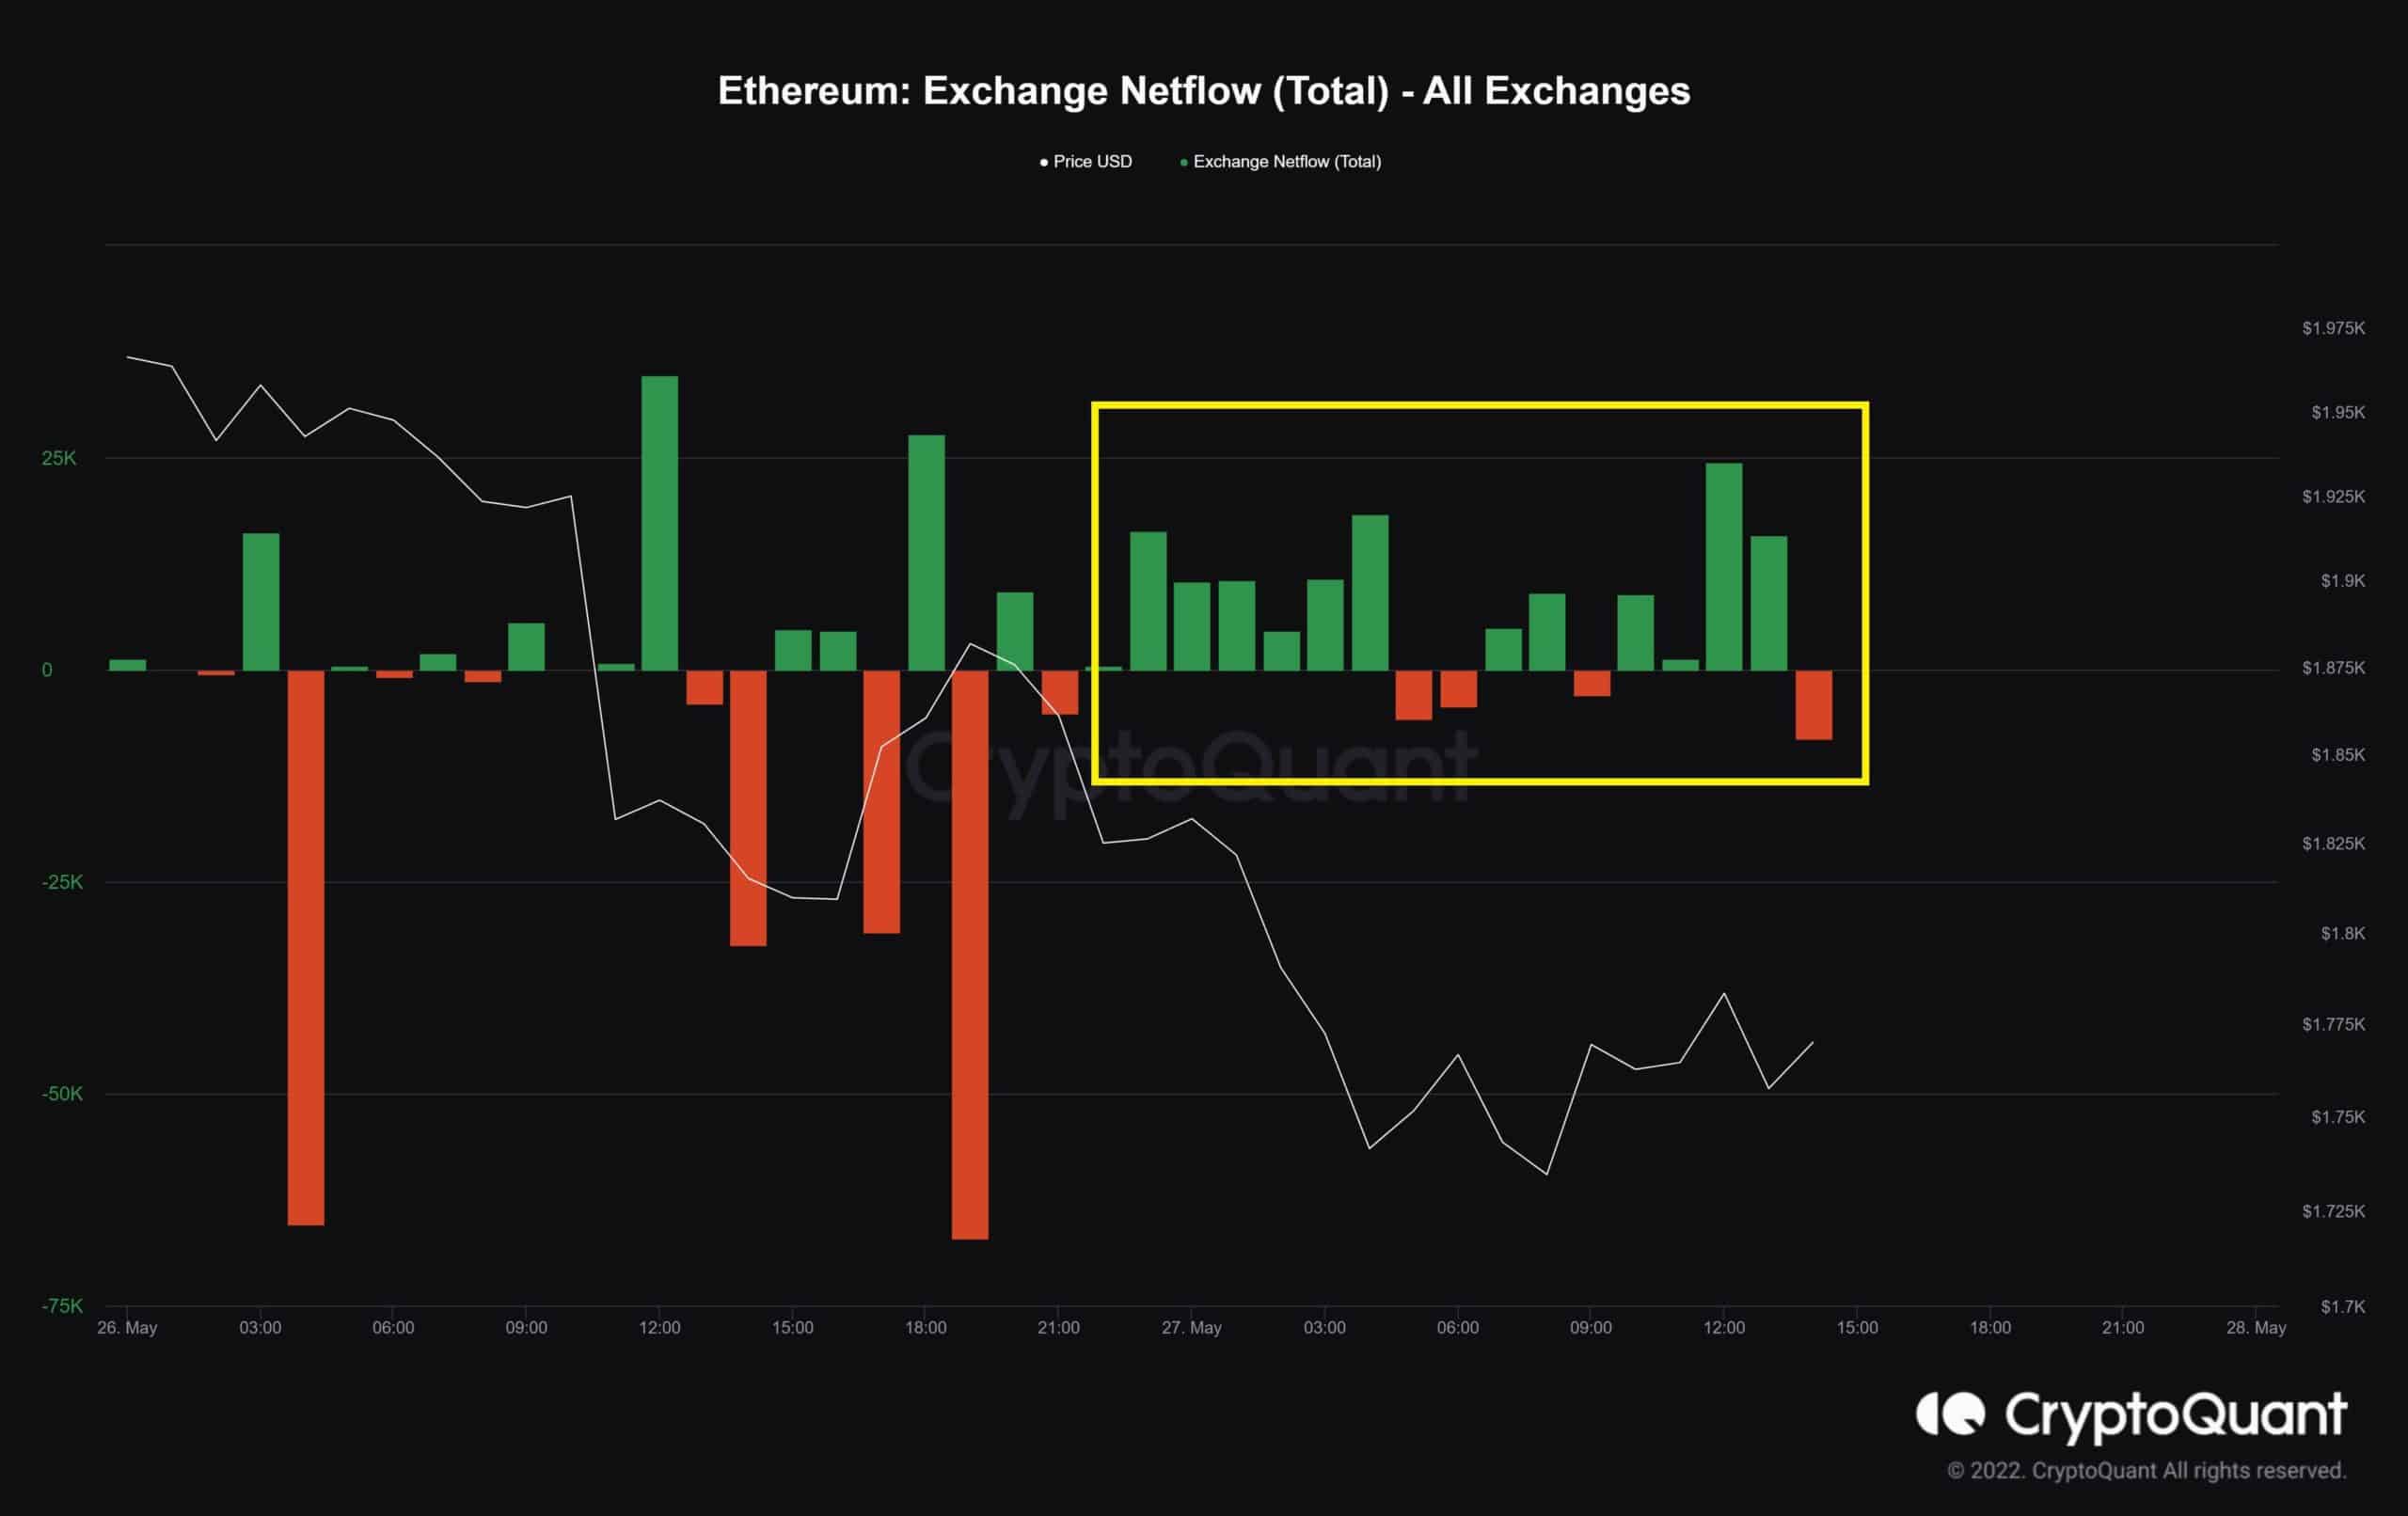
Most of this inflow is related to spot exchanges, indicating selling pressure. Therefore, it’s important to remain particularly vigilant until the outflows start increasing.