Top 5 Reasons That Suggests Bitcoin Price May Have Marked the Bottoms Earlier!

The post Top 5 Reasons That Suggests Bitcoin Price May Have Marked the Bottoms Earlier! appeared first on Coinpedia – Fintech & Cryptocurreny News Media| Crypto Guide
Bitcoin has been extremely volatile for the past 7 days and due to this, the price trend has remained uneven and highly volatile.
At the moment, it appears that the bulls have jumped in to hold the price above the lower support. Therefore, the prices are expected to rise high after a brief consolidation. Conversely, some popular analysts believe the price to test the $22,500 & $23,000 resistance zone and plunge heavily following a rejection.
On the brighter side, huge bullish signals are flashing for the Bitcoin (BTC) price that signifies the asset may have already found its bottom.
- The Macro Economic Environment
The macroeconomic factors since June have remained significantly less volatile and hence paved the way for the crypto markets to hold at the lower support. CPI rates did not drop as expected but maintained a slow decline, while the G.D.P rose notably.
On the other hand, the unemployment rates remain slashed considerably along with a drop in the housing & rent prices. The supply chain has also recovered as the demand for oil has dropped. The Ukraine-Russia crisis also appears to reach its destiny soon which signifies the conditions to be as normal as usual.
- Reduced Intensity of the Bull & Bear Markets
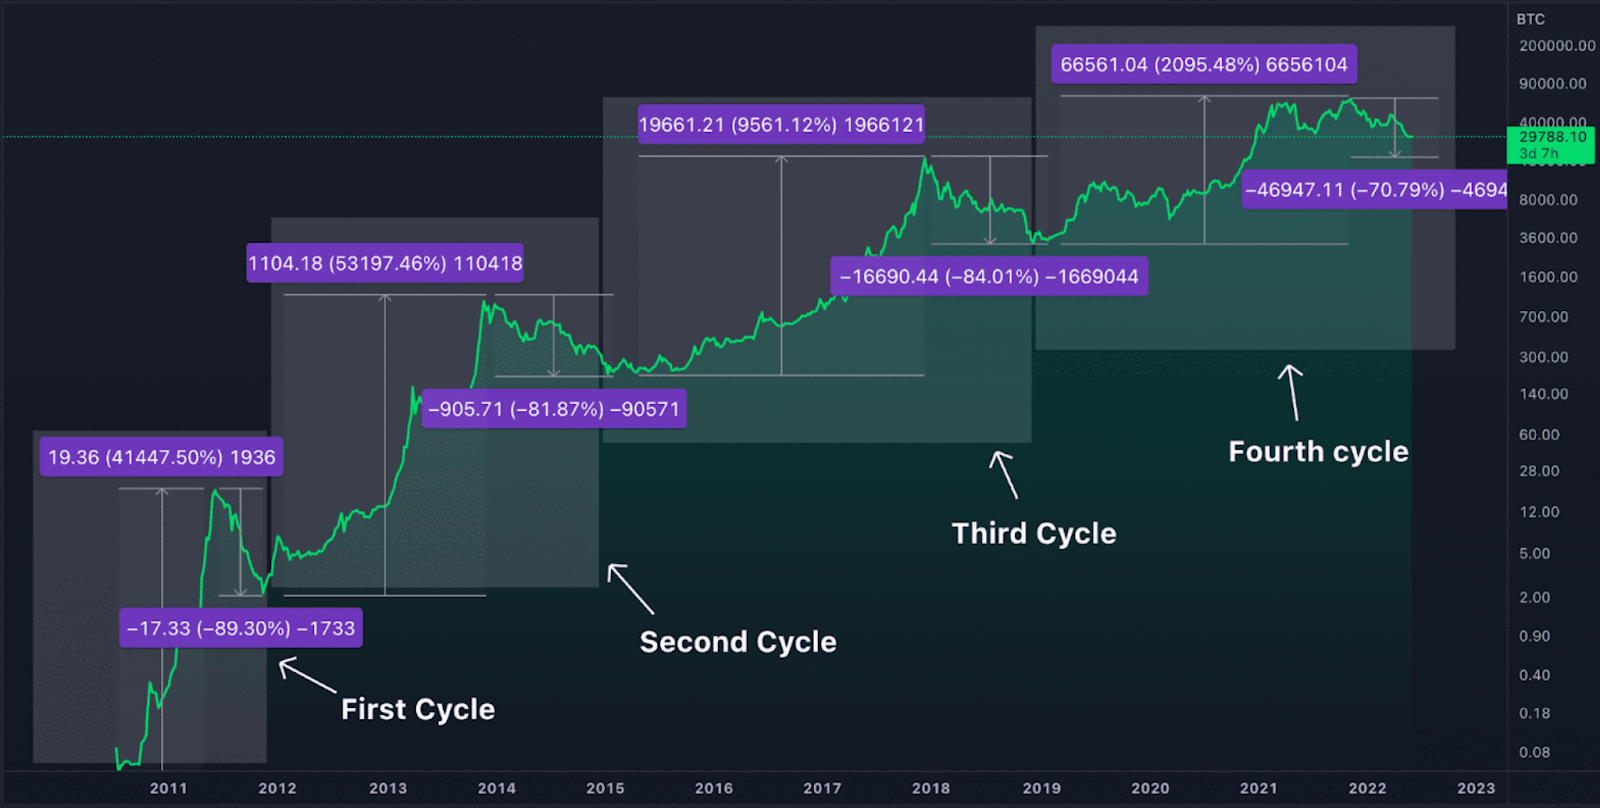
Bitcoin in recent times appears to have reduced its intensity within the bull market and also in the bear markets. In 2013, BTC price surged 4x, which slashed to 1x in 2017 and only 0.2x in 2021.
While the bearish impact also reduced as the BTC price dropped by 86% in 2014, 83% in 2018 & around 75% in recent times. Along with the intensity, the timeline from the ATH to the bottom has also slashed from 405 days in 2014 to 364 days in 2018. So far the current bear market has been for 308 days.
Therefore, if Bitcoin has to reach the bottom, it needs to reach it within the next 60 days.
- The Historical price action
If the chart patterns of the 2018 bottom are compared to that of the current bearish cycle, then one can correlate both patterns. The price dropped in 2 to 3 phases which included a huge plunge followed by a stagnant trend. After a brief consolidation, the price again drops heavily to mark bottoms. Further, the consolidation ends by plunging back close to the bottoms.

- No Specific correlation with Stock Market
Some believe Bitcoin price flows in the direction of the stocks while both the markets displayed their independent trends at times. Therefore, one cannot materialize a specific co-relation between the crypto markets & stock markets in recent times.
- Bitcoin Continues to Trade within the Pattern
Regardless of the short-term price fluctuations, Bitcoin price has largely maintained its trend within the predetermined pattern from the beginning. After accomplishing 3 cycles, Bitcoin is on the verge to accomplish the 4th one.
Wrapping it up, Bitcoin price is currently the most discussed topic within the crypto space as the trend of the other altcoins may have a huge impact ahead. From the above-mentioned points, it may be concluded that BTC price may certainly not mark new bottoms unless & until a major black swan event drags the entire crypto space down.
Till then, the Bitcoin (BTC) price despite being within a bearish influence could continue to trend in a bullish pattern in the long term.