A Breakout Past This Level Can Make Fantom Touch $1
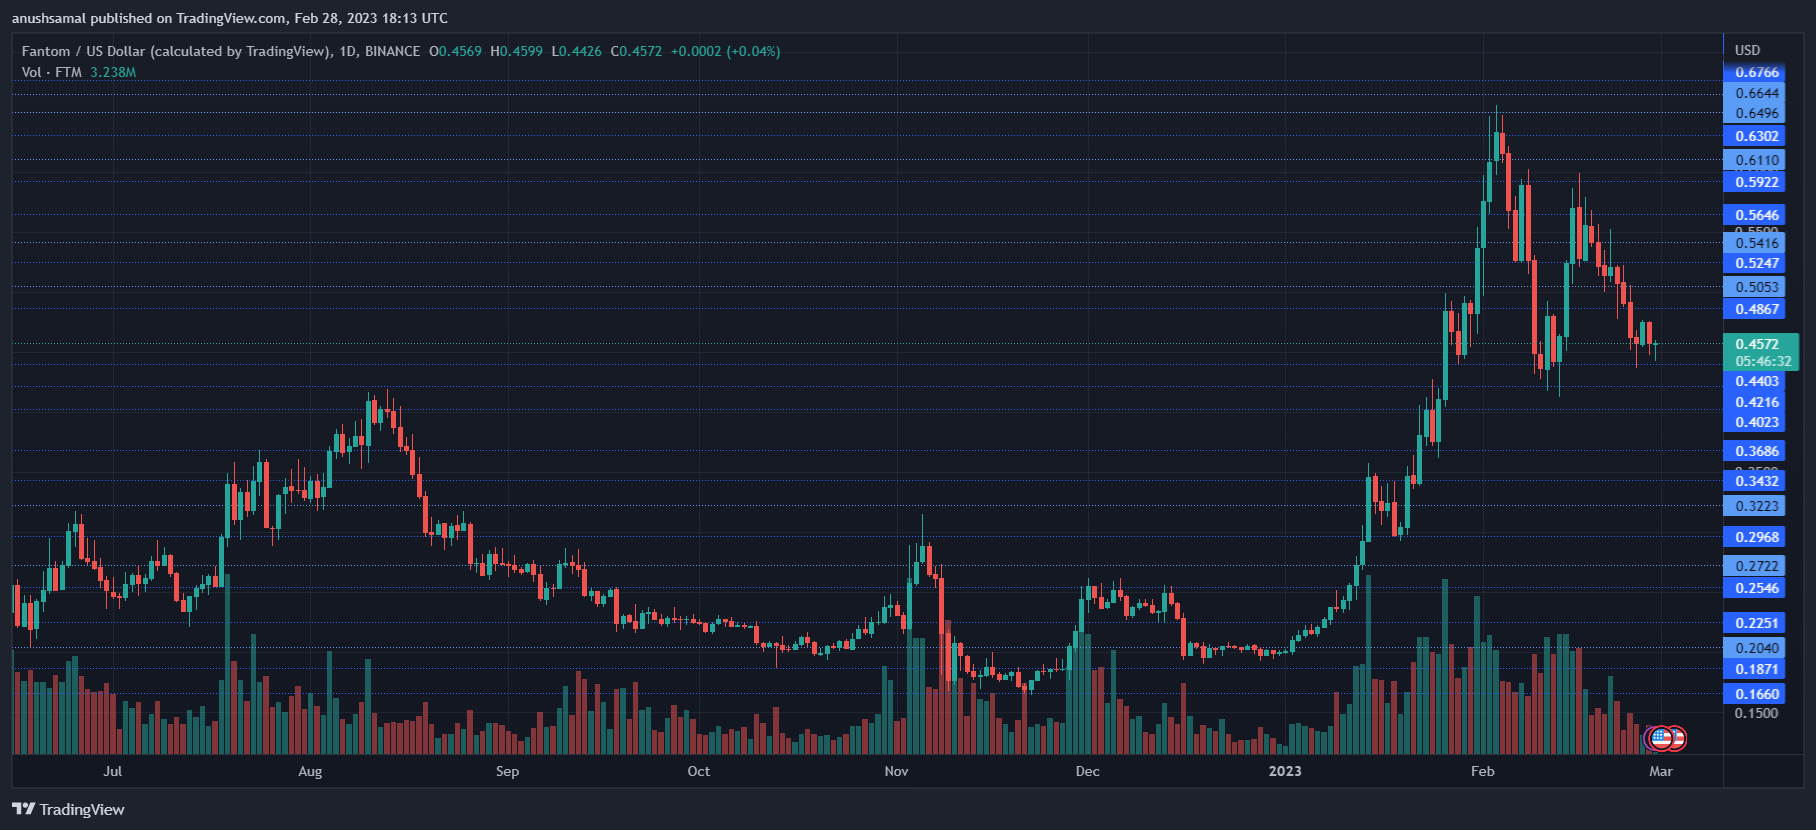
The Fantom price remained quite volatile at the end of last year and even at the beginning of this year. FTM lost over 10% of its market value in the previous week alone. Over the last 24 hours, the altcoin managed to gain 0.4% of its lost value.
This movement on the daily chart confirmed that the coin was laterally trading. The Fantom price maintained a bearish technical outlook on the daily chart. Demand for the altcoin remained low as buyers started to exit the market.
Accumulation also dropped as a reason. For FTM to register a strong price move, it must continue to trade above the closest support line. If Fantom continues to remain rangebound, then the price of the asset will register another fall before it starts to exhibit a recovery on its chart. Fantom is trading 87% below its all-time high secured in 2021.
Fantom Price Analysis: One-Day Chart
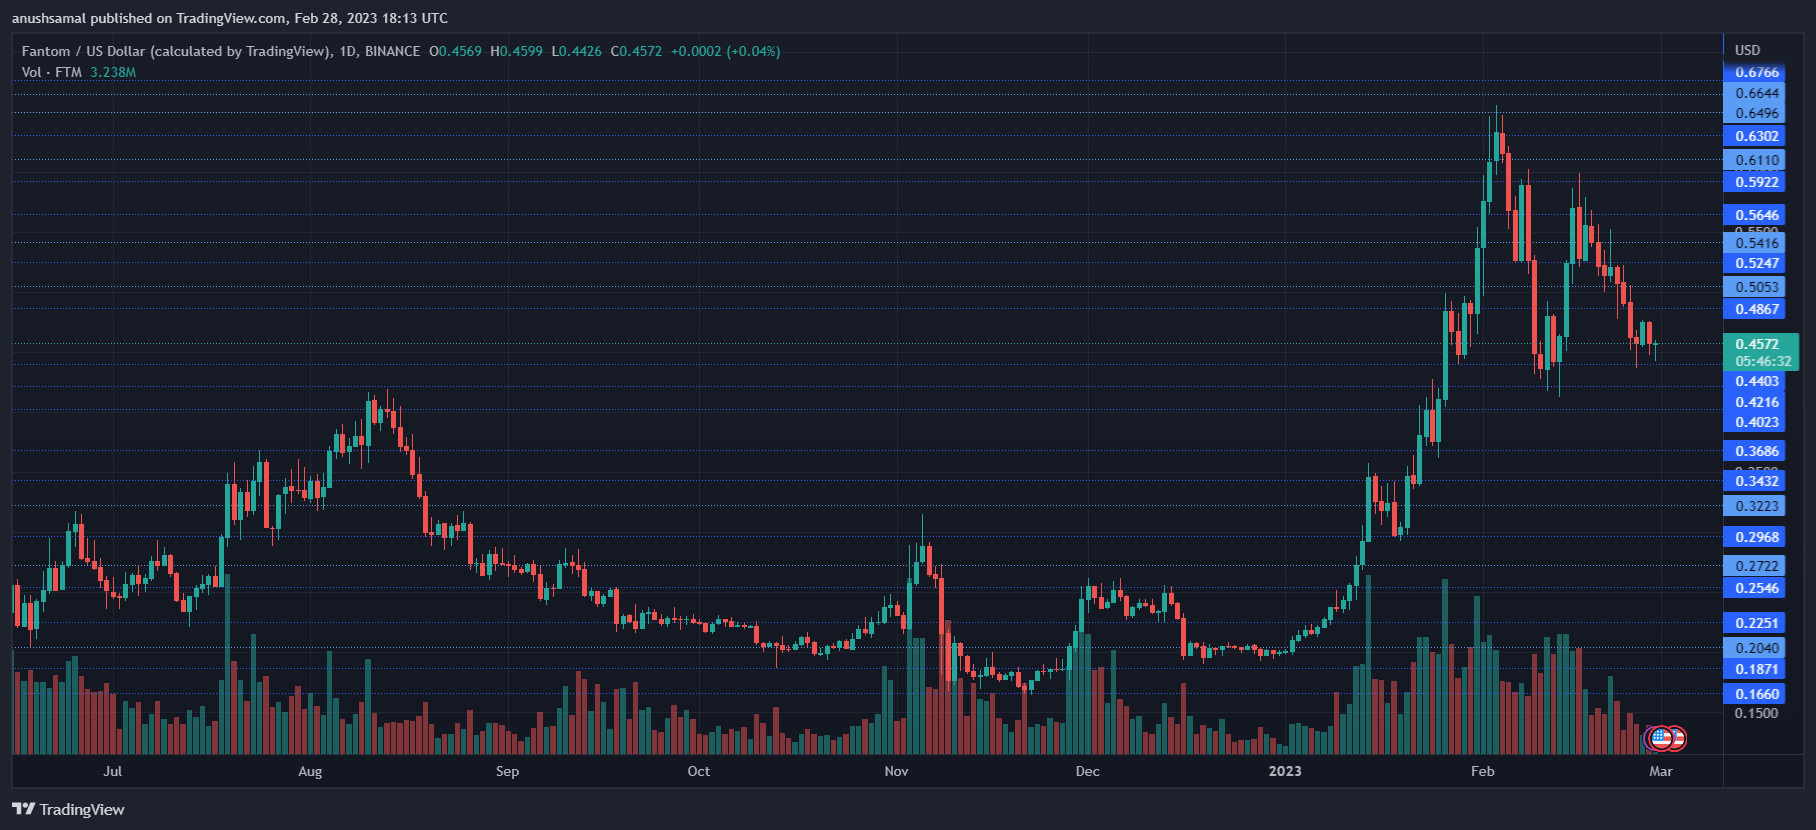
FTM was trading at $0.45 at the time of writing. Fantom is currently rangebound, with the altcoin trading within a close range that spans between $0.40 and $0.60. Immediate resistance for the altcoin was $0.48; moving above that level can take the asset’s price to $0.52.
If buying pressure continues to rise on the chart, FTM may break past multiple resistance levels and trade at $0.80 before attempting to touch the dollar mark.
On the other hand, support for the altcoin was at $0.40 and then at $0.36. Falling below the $0.36 mark will let the bears take over completely. The amount of Fantom traded in the last session declined as sellers dominated at press time.
Technical Analysis
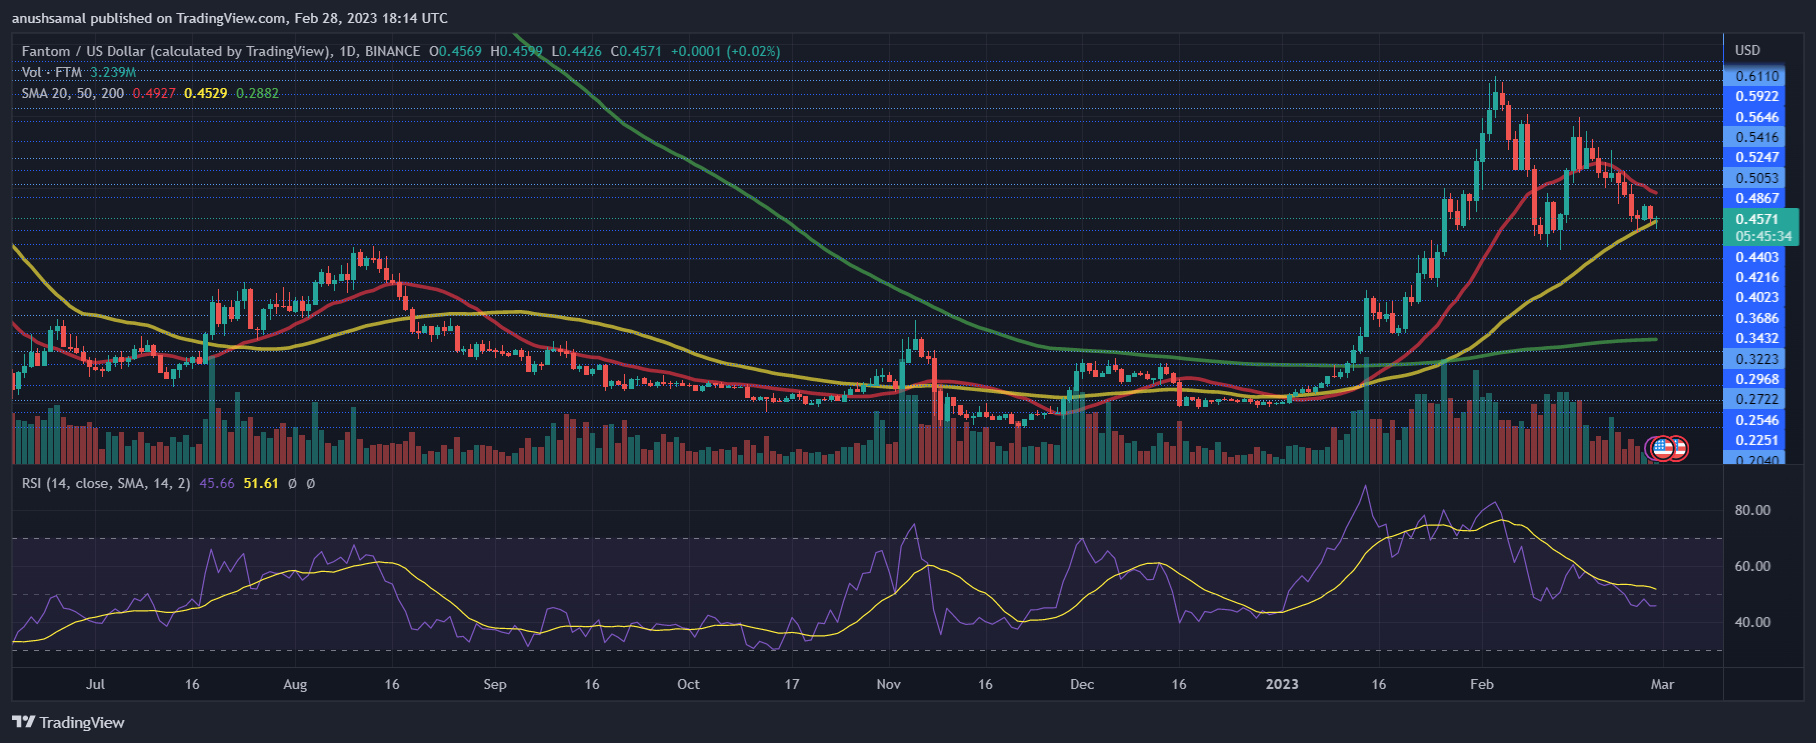
Since the bulls were rejected from the $0.60 level, buying strength has struggled to recover for the past few weeks. The Relative Strength Index fell below the neutral mark, an indication that buyers were fewer in number than sellers.
For FTM to invalidate the bears, demand for the altcoin needs immediate recovery. On the same note, the FTM price fell below the 20-Simple Moving Average (SMA) line as sellers drove the market’s price momentum.
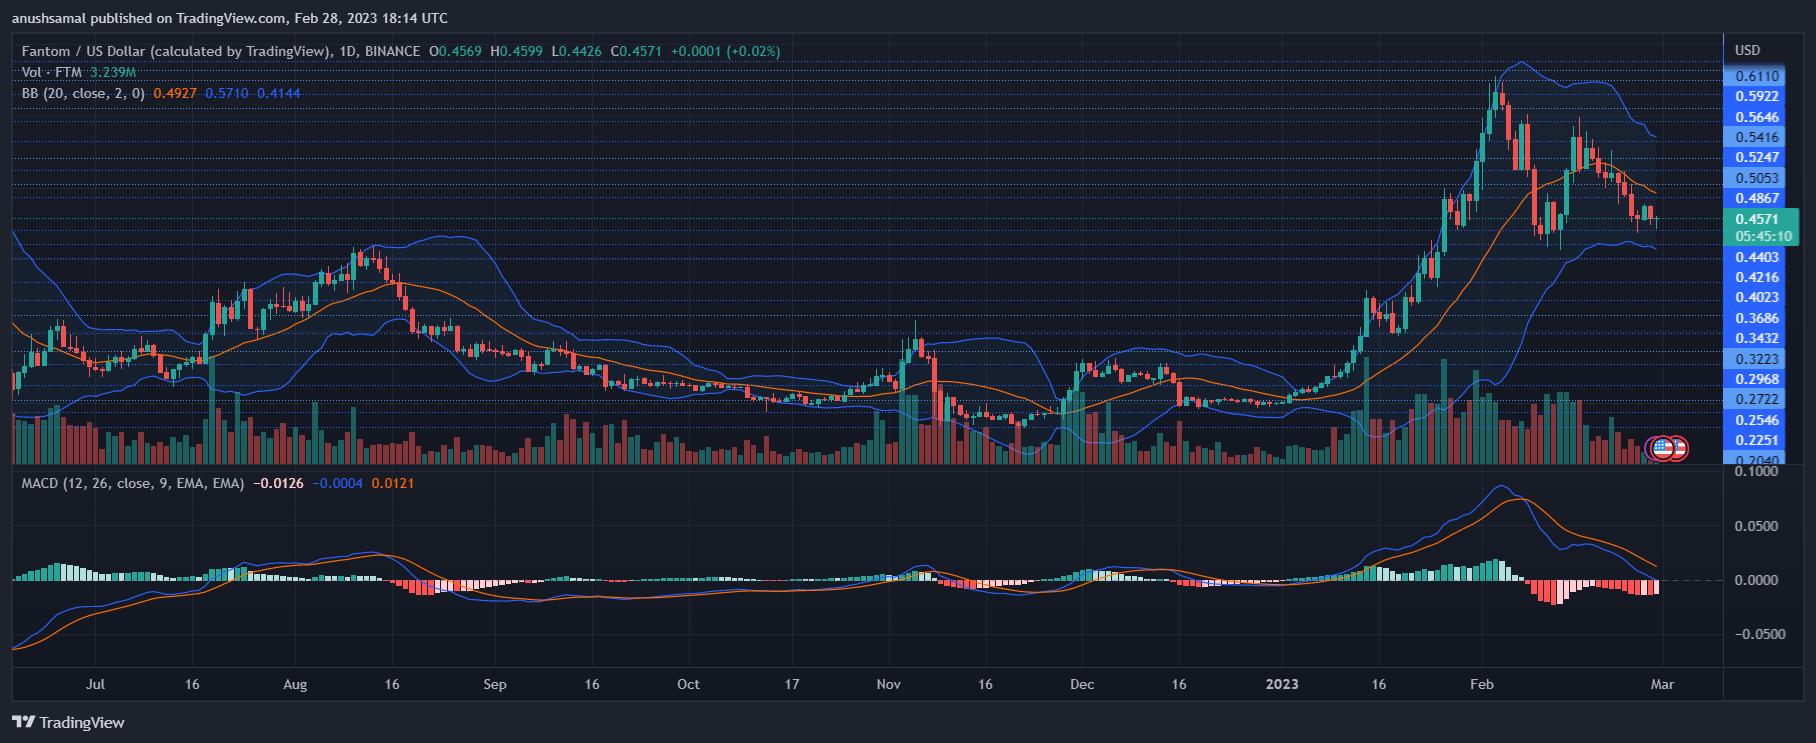
FTM also depicts sell signals on the daily chart regarding falling buying strength. The Moving Average Convergence Divergence displayed red histograms; this reading also meant that sellers might become more active over successive trading sessions.
Bollinger Bands measure price volatility. The indicator suggests price momentum and changes in the same. The bands were parallel and wide, which implied that FTM could break out in the near term. Now, traders should only stick to buying and selling the asset near the range extremes.

