Polkadot (DOT) Price Slumps Below $6 – Any Chances For Reversal?

The price of Polkadot (DOT) has been gradually moving south over the past few days. The price decline cuts across the entire crypto market, with strong signs of bears. The cumulative market cap has dropped by 2.58% to sit at $1.25 trillion in 24 hours.
DOT has finally lost its grip on the $6 region as the bears became aggressive on the token over the past 24 hours. The market is wondering if Polkadot still has a chance to reverse the downtrend.
Polkadot Price Drops Drastically With Prevailing Bearish Trend
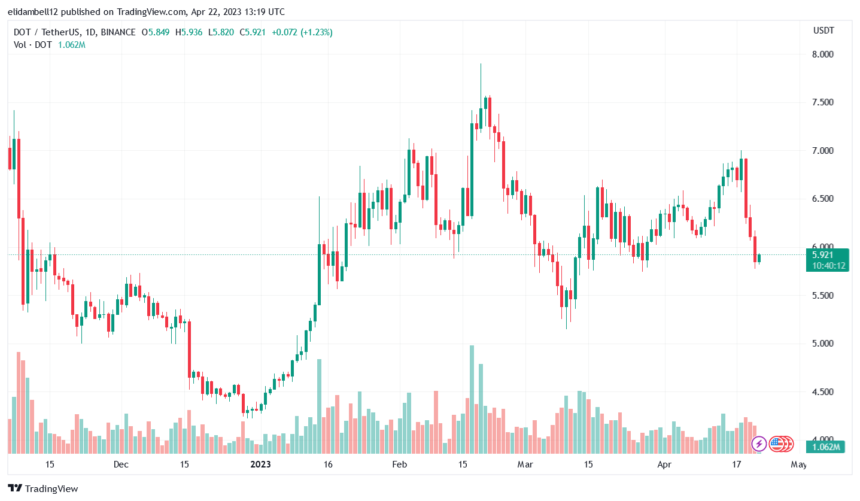
The past few days seem to be turning out more negatively for DOT. The asset hovered between $6.1 and $6.9 last week except on April 21, when it dipped.
Currently, the 60-day and 90-day price action for Polkadot shows negative values of 4.45% and 5.36%, respectively. Also, DOT dipped by 12.46% over the past 7 days.
After losing its hold on the price level of $7 in February, DOT has maintained a trading price within the $6 region. As of April 21, the price of DOT dropped to its resistance point of $5.8 before correcting.
However, the price analysis of DOT for the past 24 hours shows the token is gradually going down again within the past few hours.
At the time of writing, DOT is trading at $5.921, indicating a slight reversal after plunging. The bearish push on DOT from the past few days has spilled over to the weekend.

The crypto market is undergoing a bearish trend, with most crypto assets battling for price stability. Polkadot is included in the market performance. Hence, the selling pressure for the token has exceeded its buying pressure, forcing the price of DOT below the $6 region.
Bears Push DOT Below $6
After three consecutive red days, DOT has formed a green candle on the price chart. However, the bears are still in control as they struggle to reclaim past price levels.
DOT has dropped below its 50-day and 200-day Simple Moving Averages (SMA), indicating a bearish sentiment in the short and long term.
DOT’s support levels are $5.15 and $5.75. A decline below its support will bring further price fall. Also, the resistance levels are $6.71 and $7.89. However, the $6 price level has transformed into a psychological resistance level.
The Relative Strength Index (RSI) indicator is 39.74, close to the oversold region of 30. However, the indicator points upwards, suggesting a bullish reversal in the short term.
DOT’s indicators are mostly bearish. Its next price action depends on traders’ decisions in the coming weeks. Further drop into the oversold region will likely lead to a trend reversal at the $5.75 support level.
Featured image from Pixabay and chart from Tradingview


