Inside stablecoin supply dynamics as TUSD shakes up the market
Understanding the dynamics of stablecoin supplies is a crucial aspect of crypto market analysis, as stablecoins play a pivotal role in the cryptocurrency ecosystem.
Fluctuations in the market cap of these pegged assets can signal shifts in investor sentiment, liquidity changes, and overall market health.
In 2023, the stablecoin market witnessed a significant shift, with Tether (USDT) and TrueUSD (TUSD) emerging as market leaders.
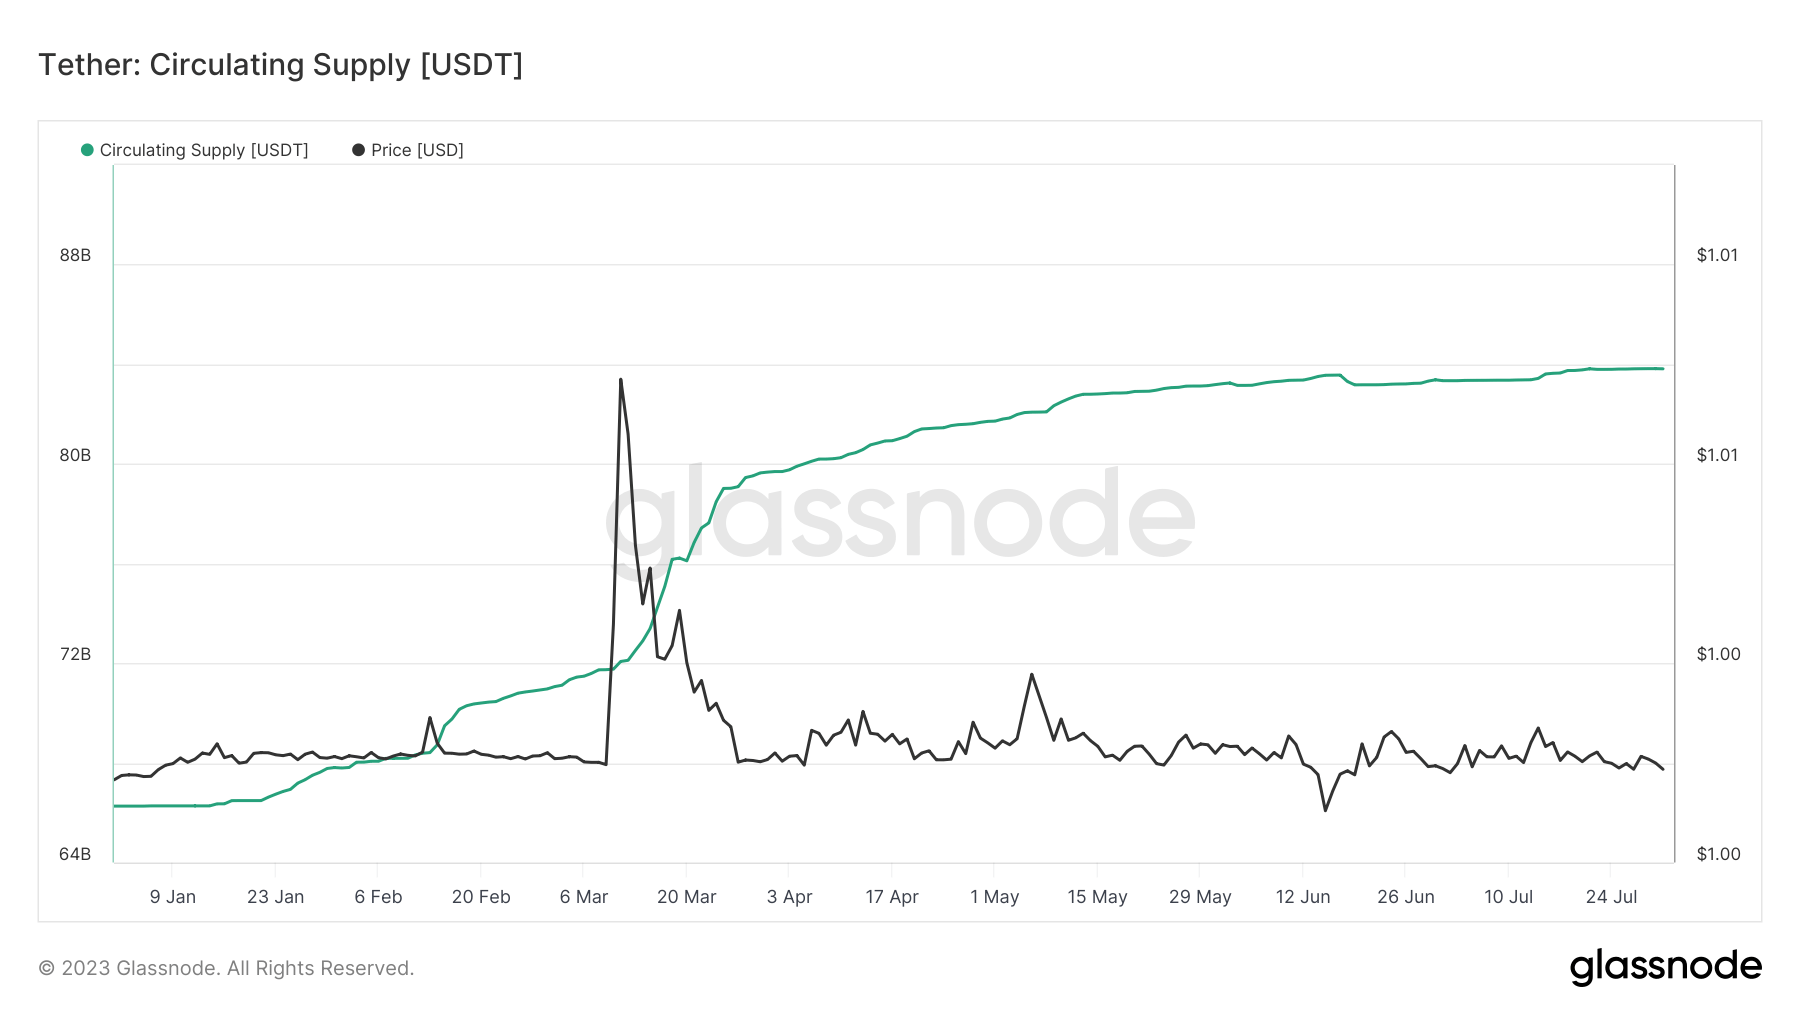
The supply of USDT reached an all-time high of $83.81 billion on July 31, surpassing its previous peak of $83.16 billion in May 2022. This represents a substantial growth of 26.50% since the beginning of the year.
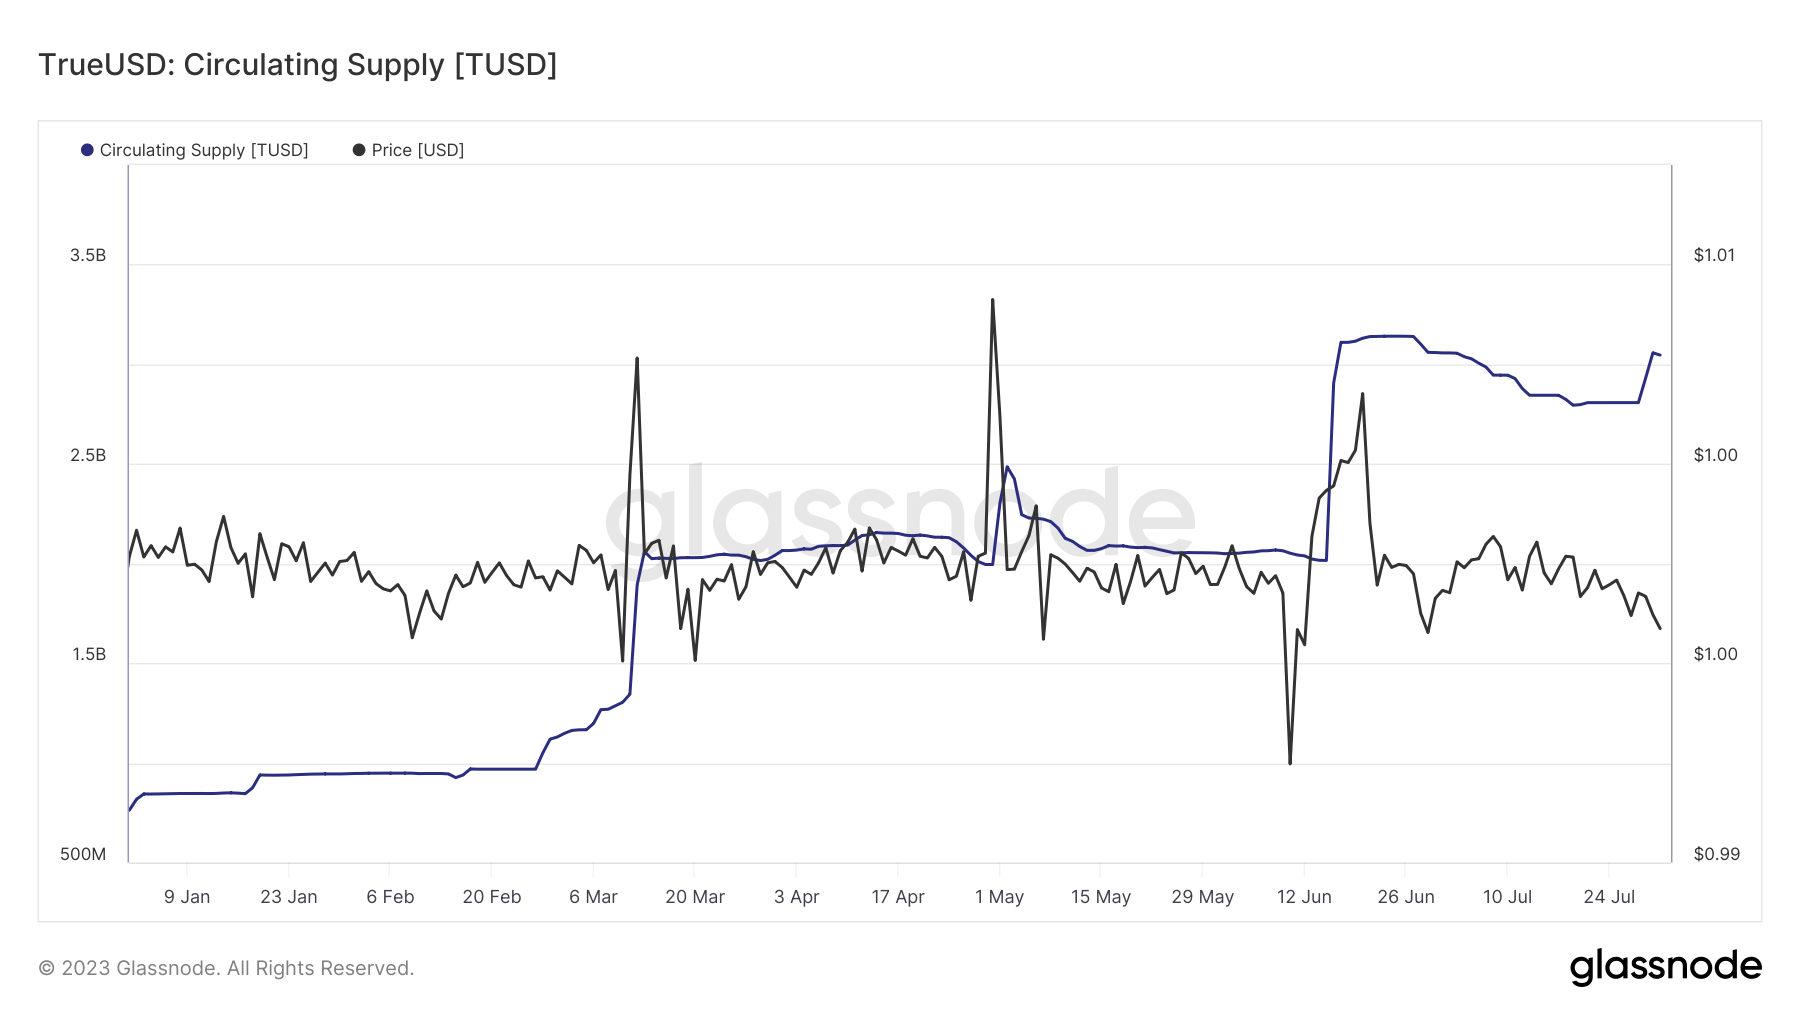
TUSD also reached its peak on June 26, with a supply of $3.14 billion. The recent surge, as previously analyzed by CryptoSlate, pushed TUSD’s supply back above $3 billion, currently standing at $3.05 billion. TUSD’s supply has grown by almost 300% since the start of the year.
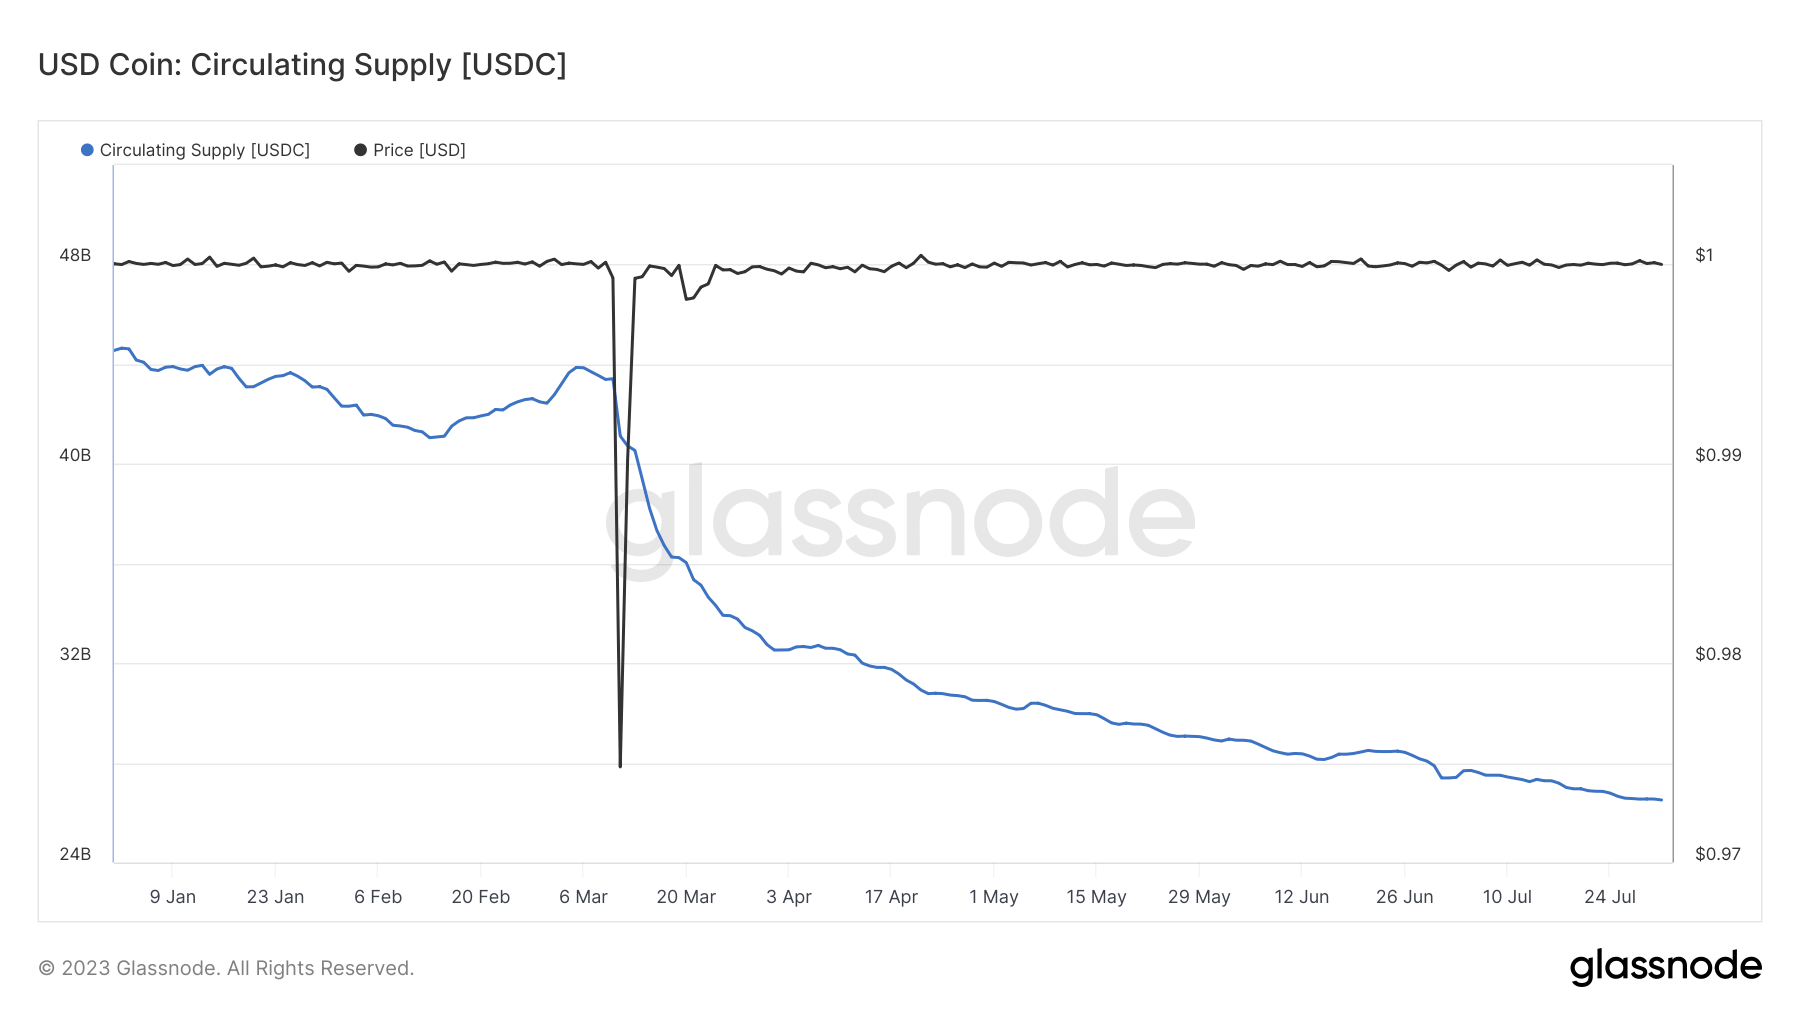
However, other major stablecoins have experienced a sharp drop in their supplies. Despite a significantly higher supply than TUSD, USDC has experienced a 40% decrease since the beginning of the year, with its current supply standing at $26.51 billion.
The drop was exacerbated in March when USDC briefly de-pegged, trading as low as $0.97. A de-pegging event, where a stablecoin deviates from its pegged value, can indicate market instability and erode trust in the asset.
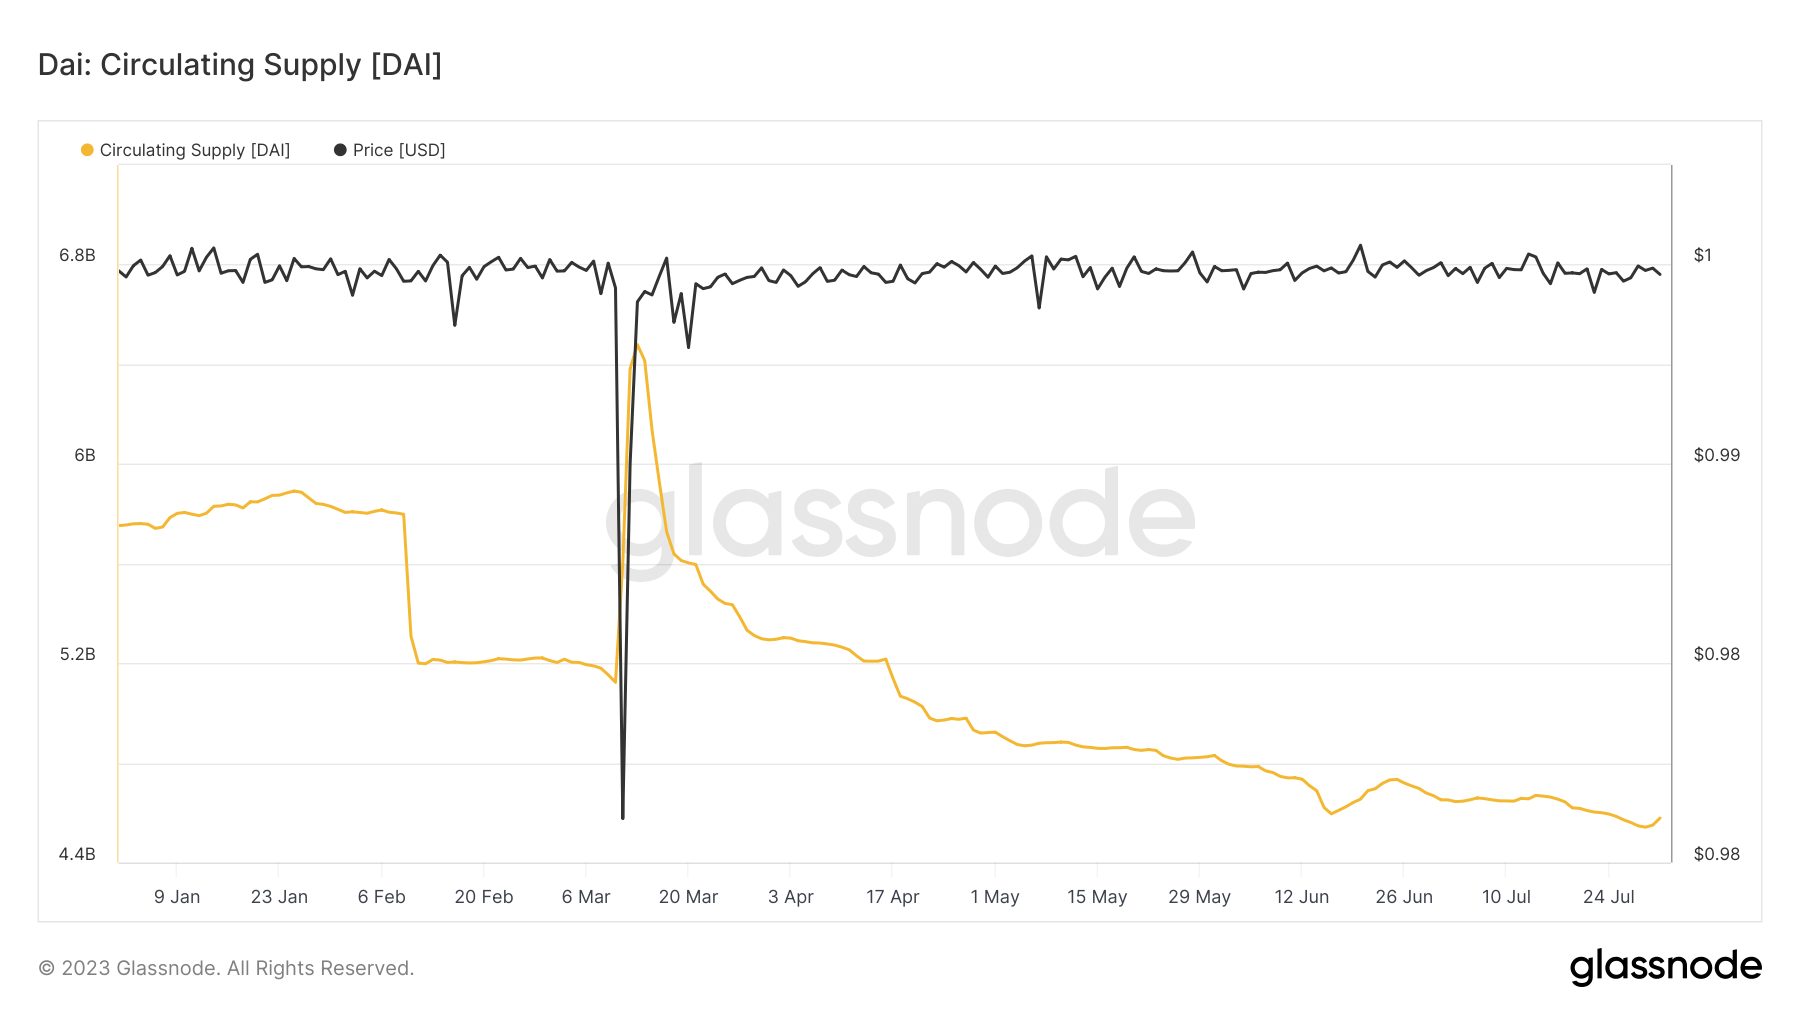
DAI, another prominent stablecoin, also experienced a de-peg at the same time, but its supply initially increased. However, this increase was short-lived, and the downward trend quickly re-established. The supply dropped from $5.75 billion at the beginning of the year to $4.57 billion on July 31, representing a 20% decrease.
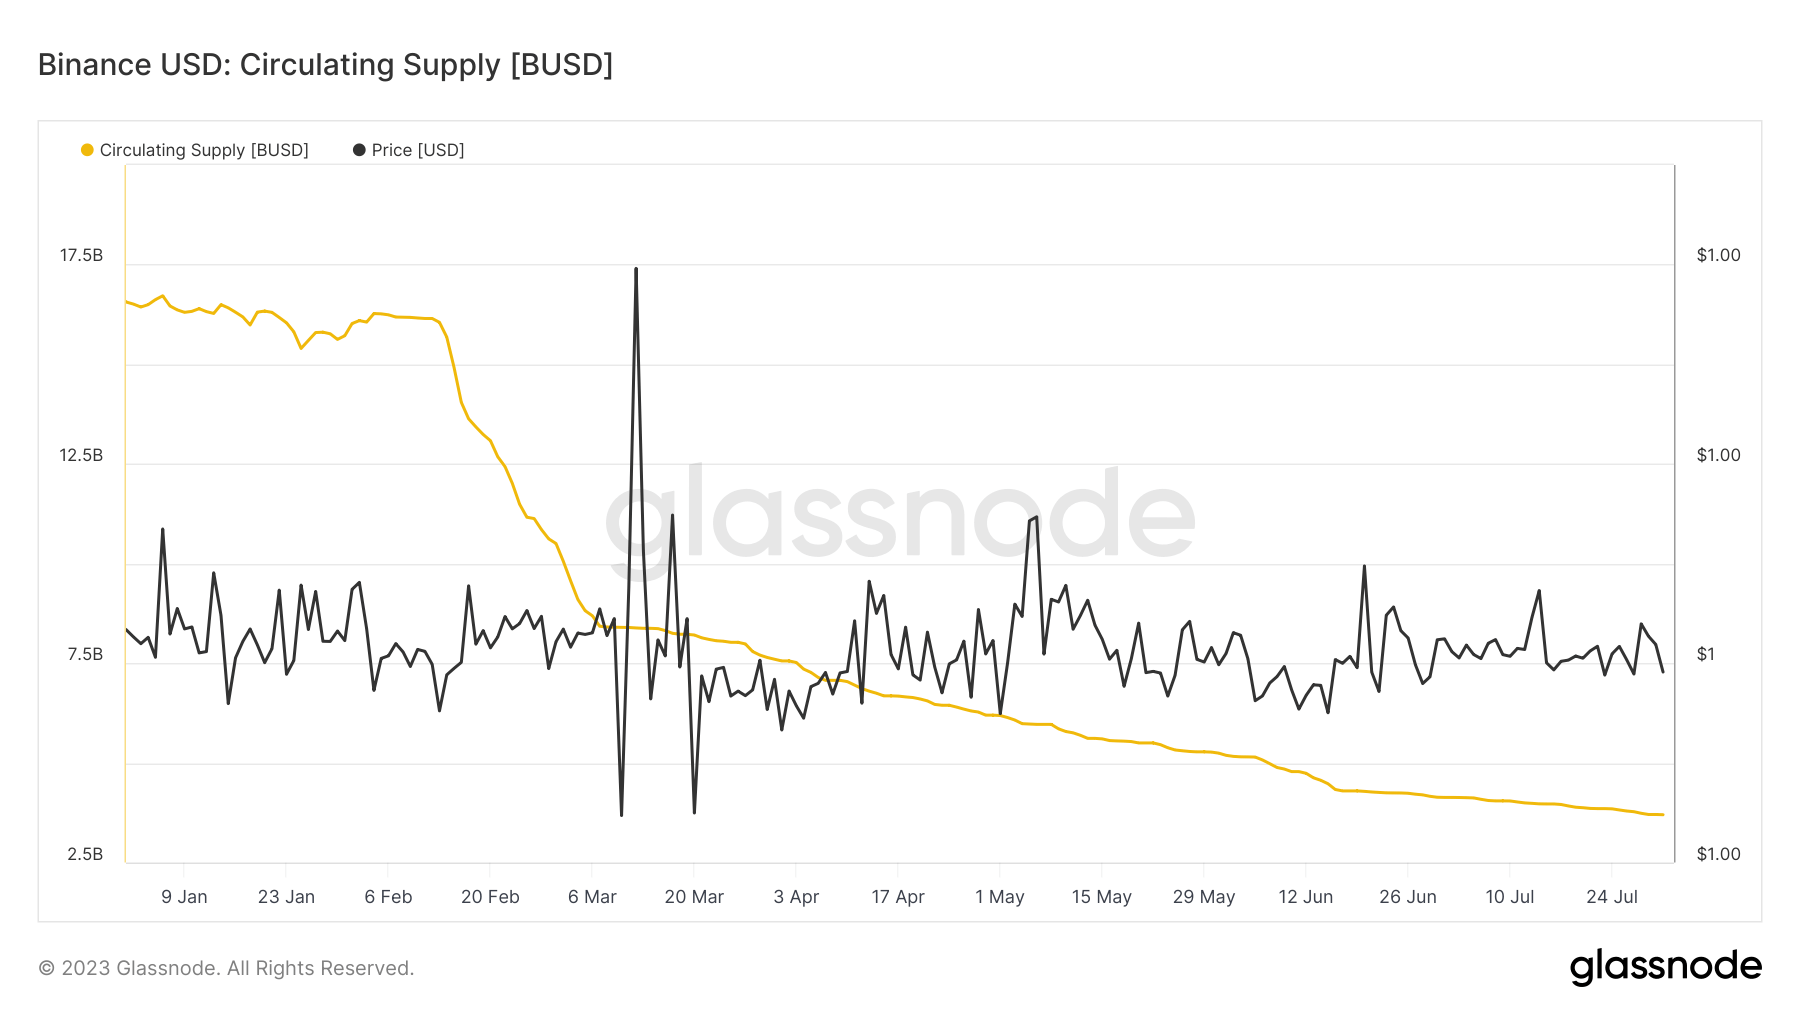
The most significant decrease in supply was seen in Binance USD (BUSD), a stablecoin linked to the Binance exchange. The supply reduced by over 77%, dropping from $16.50 billion at the beginning of the year to $3.69 billion on July 31.
Due to a pending lawsuit filed by the United States Securities and Exchange Commission (SEC), Paxos has stopped the issuance of the BUSD stablecoin, stating, ” Paxos no longer mints new BUSD, but allows customers to redeem BUSD for USD or convert their BUSD to USDP,”
These shifts in stablecoin supplies underscore the dynamic nature of the crypto market. The rise of USDT and TUSD, coupled with the decline of other major stablecoins, may signal a change in investor preference and trust, with more capital flowing to assets investors and traders deem safer or more liquid.
| Rank | Name | Ticker | Market Cap | 24H Vol |
|---|---|---|---|---|
| 1 | Tether | USDT | $83,801,671,209 | $22,547,202,621 |
| 2 | USD Coin | USDC | $26,446,685,467 | $3,399,720,920 |
| 3 | Dai | DAI | $4,558,160,395 | $212,842,536 |
| 4 | Binance USD | BUSD | $3,667,705,148 | $1,662,534,530 |
| 5 | TrueUSD | TUSD | $3,014,429,130 | $2,937,994,931 |
The post Inside stablecoin supply dynamics as TUSD shakes up the market appeared first on CryptoSlate.


