More Blood Ahead? Why Bitcoin Could Crash Further If It Loses $26,000
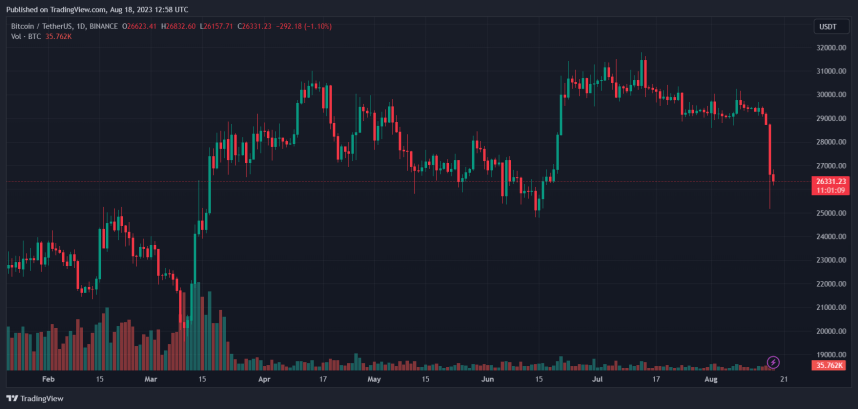
The Bitcoin price range has been obliterated as the crypto market was corrected into a final support line. Volatility in the sector was compressed for weeks, and many were expecting some action in the short term, but the drop caught market participants by surprise as BTC kept on pushing lower.
As of this writing, Bitcoin trades at $26,400, with an 8% loss in the last 24 hours. BTC recorded a 10% correction in the previous seven days, while some altcoins experienced a 17% and even 20% loss on BTC’s crash.
Bitcoin Ready To Re-Test Support, Your Longs Could Be In Danger
Bitcoin’s sudden crash into critical support around $25,000 saw over $1 billion in long liquidations. The number of traders waiting for a breakout at $30,000 provided the downside with a lot of liquidity, as NewsBTC reported yesterday.
Therefore, the selling pressure was exacerbated as BTC kept on dropping. The recent crash was worse than the one experienced when crypto exchange FTX collapsed, and the crypto sector nuked all long positions by collapsing below $30,000.
Similar to that occasion, the Bitcoin price took some time to recover. According to Material Indicators and its analyst Keith Alan, the same could happen in the current market conditions.
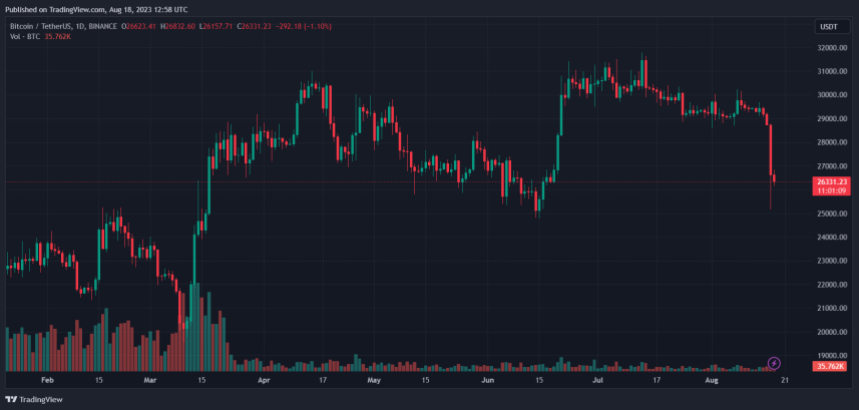
Via his official X account, Alan stated that the BTC price bottom it’s not in. The chart below shows that the analyst pointed out some key levels to watch while the number one cryptocurrency by market caps hovers at $26,000.
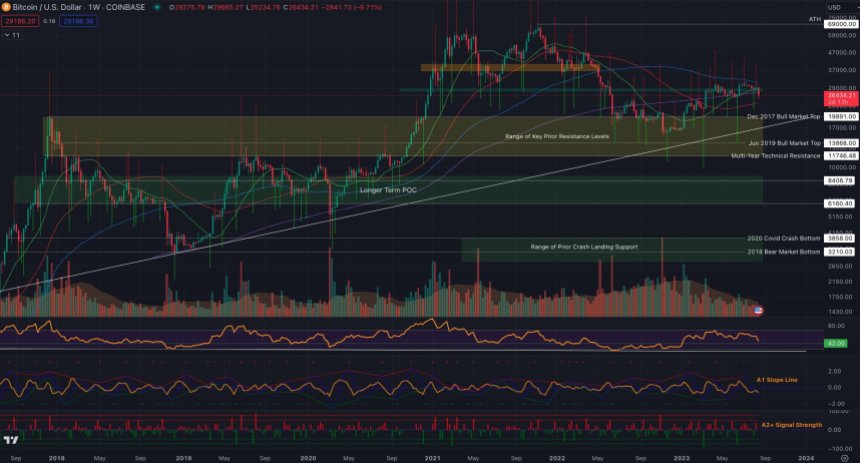
As the chart shows, the levels pointed out by Alan include the 2017 bull market top at $20,000, the 2019 bull market top at around $14,000, and even the COVID-19 lows at $3,850. The analyst stated the following regarding BTC’s potential for further losses:
(…) I can build an argument for every downrange level shown. I personally think there is a high probability of retesting sub $20k levels. That doesn’t mean that there won’t be opportunities to scalp longs along the way because whales still want to distribute as high as they can.
Cover image from Unsplash, chart from Tradingview

