Bitcoin Price Hesitates, But Further Gains Seem Likely Toward $30K

Bitcoin price is attempting a fresh increase above $28,500. BTC is eyeing another upside break toward the $30,000 resistance in the near term.
- Bitcoin found support near $28,150 and started a fresh increase.
- The price is trading above $28,500 and the 100 hourly Simple moving average.
- There is a key rising channel forming with resistance near $29,000 on the hourly chart of the BTC/USD pair (data feed from Kraken).
- The pair could continue to rise if there is a close above the $29,000 resistance.
Bitcoin Price Eyes Upside Break
Bitcoin price struggled below the $29,000 level. BTC even traded below the $28,250 level before the bulls appeared. The price found support near the $28,150 zone and recently started a fresh increase.
There was a move above the $28,400 and $28,500 resistance levels. The price cleared the 61.8% Fib retracement level of the downward move from the $28,980 swing high to the $28,150 low. There is also a key rising channel forming with resistance near $29,000 on the hourly chart of the BTC/USD pair.
Bitcoin is now trading above $28,500 and the 100 hourly Simple moving average. It is slowly gaining pace and consolidating near the 76.4% Fib retracement level of the downward move from the $28,980 swing high to the $28,150 low.
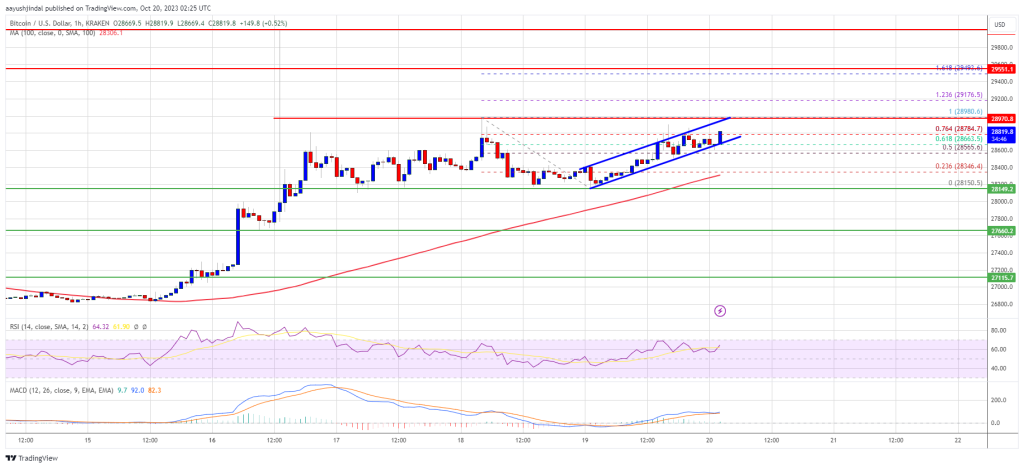
Source: BTCUSD on TradingView.com
On the upside, immediate resistance is near the $28,950 level. The next key resistance could be near $29,000 and the channel region. A close above the $29,000 resistance zone could set the pace for a larger increase. The next key resistance could be $29,500. Any more gains might send BTC toward the $30,000 level, above which the bulls might aim for $31,200.
Another Decline In BTC?
If Bitcoin fails to rise above the $29,000 resistance zone, it could start another decline. Immediate support on the downside is near the $28,650 level.
The next major support is near the $28,350 level and the 100 hourly Simple moving average. The main support is now forming near $28,150. A downside break and close below the $28,150 support might trigger more losses in the near term. The next support sits at $27,650, below which it could test $28,120.
Technical indicators:
Hourly MACD – The MACD is now gaining pace in the bullish zone.
Hourly RSI (Relative Strength Index) – The RSI for BTC/USD is now above the 50 level.
Major Support Levels – $28,650, followed by $28,150.
Major Resistance Levels – $28,950, $29,000, and $30,000.