Transactions on Avalanche surge by 3,040% in November
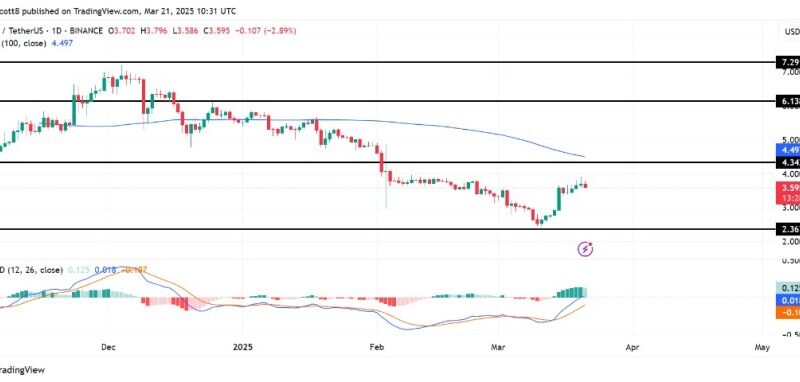
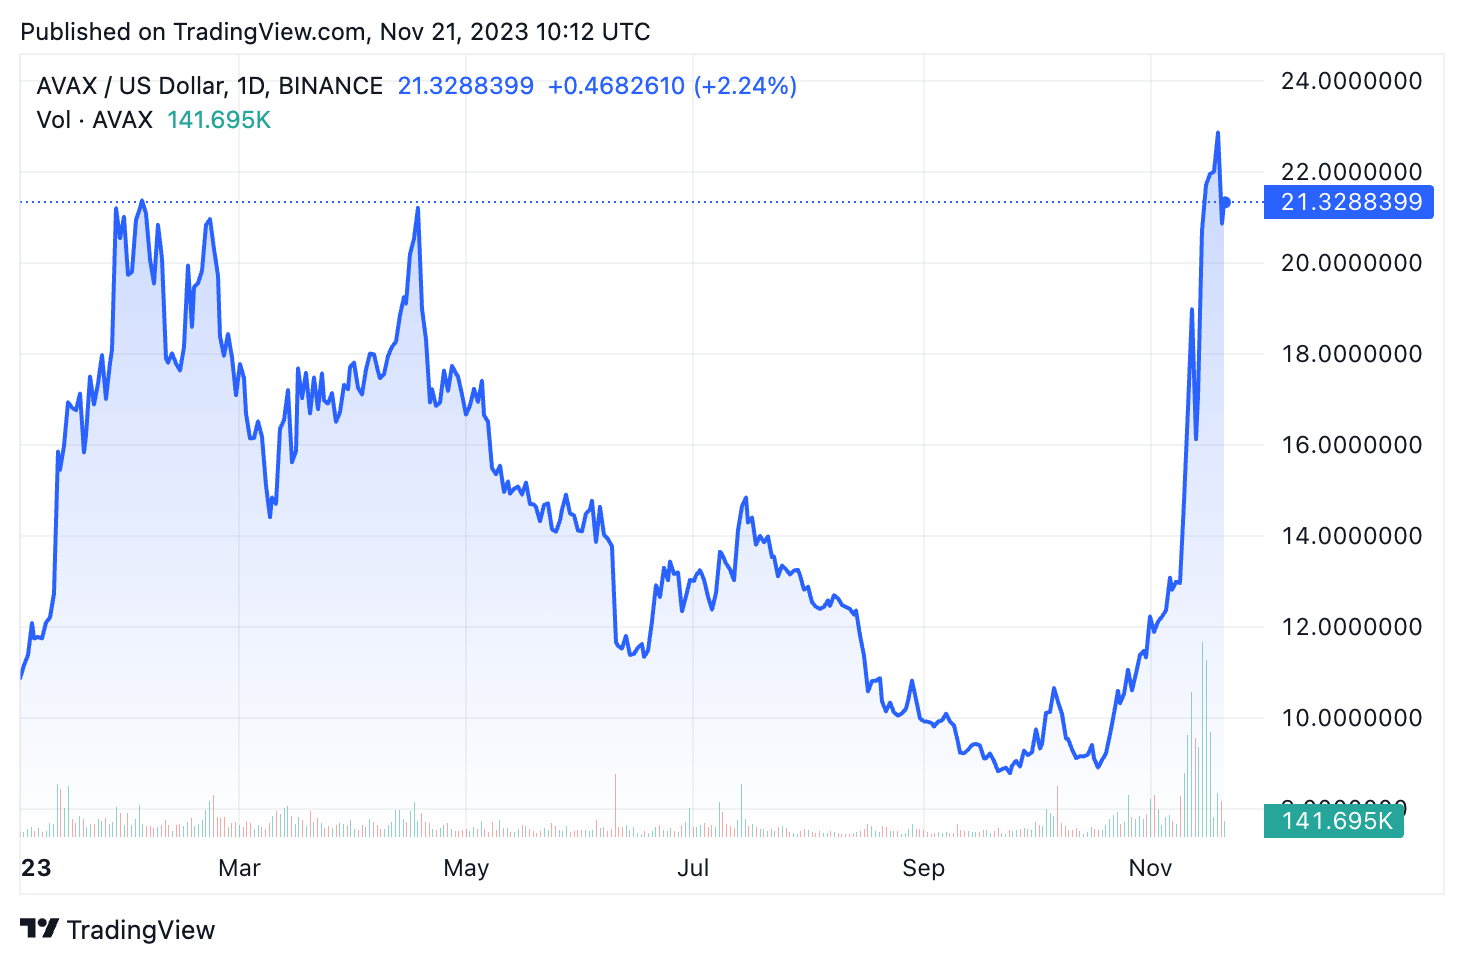
Avalanche has seen a significant increase in its market value this year. The token has grown substantially with impressive monthly, year-to-date (YTD), and yearly gains. AVAX’s price has surged by over 103% in the last 30 days alone, with a notable 77% increase over the past year.
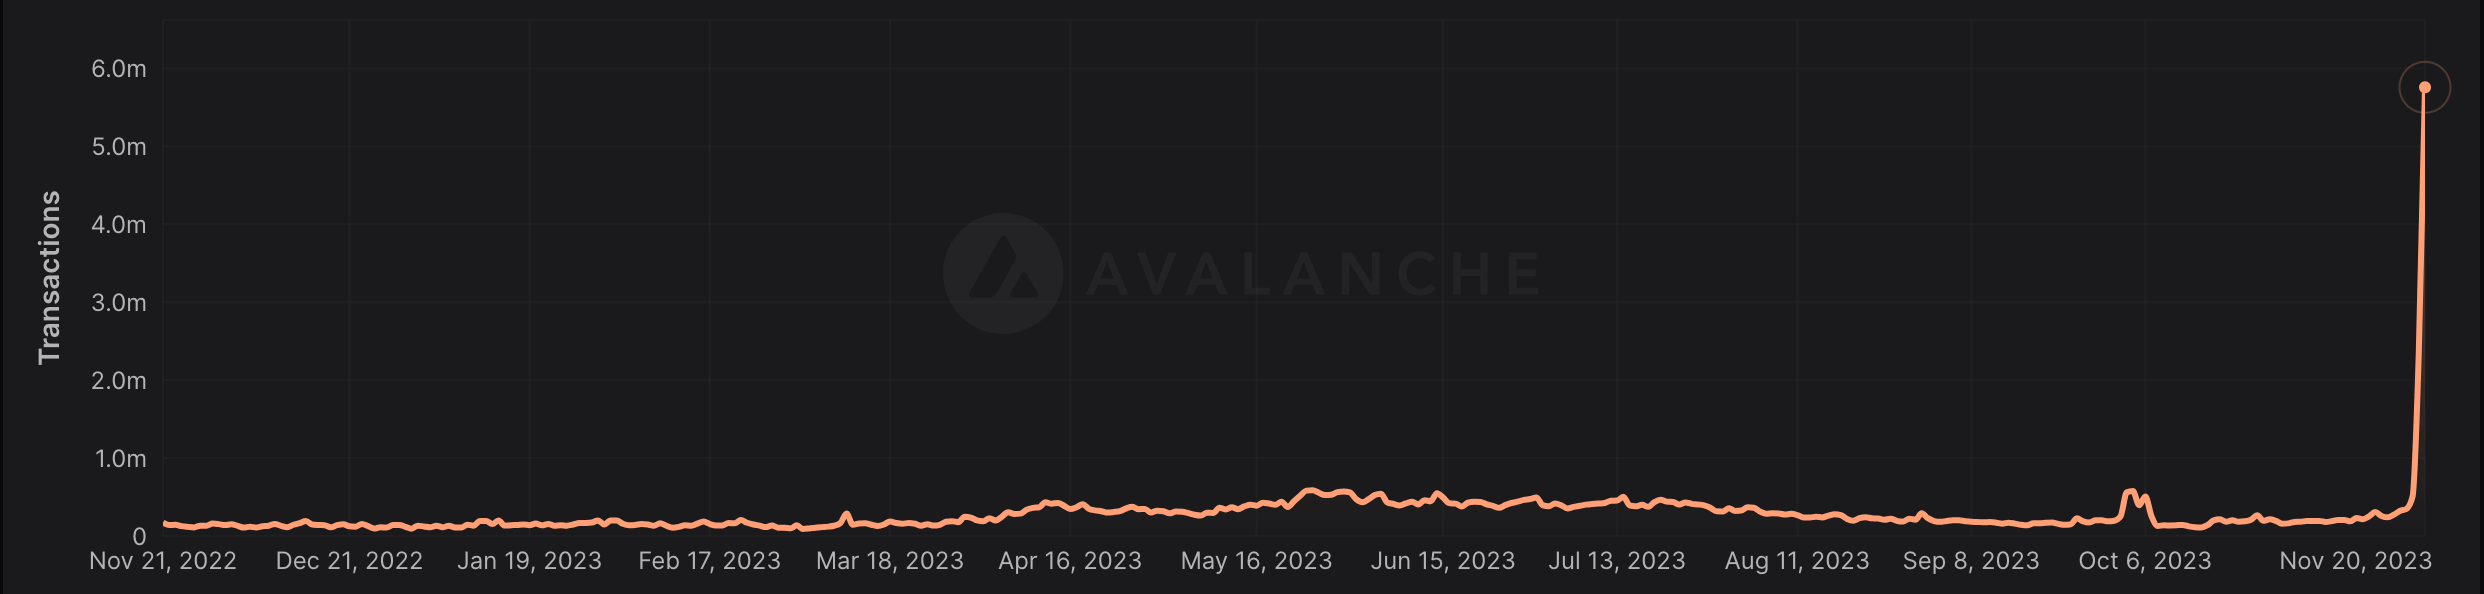
This price growth was accompanied by an even higher increase in usage and activity on the Avalanche network. The network experienced an unprecedented surge in daily transactions in November, a key indicator of network utilization and user engagement. From Nov. 1 to Nov. 20, daily transactions skyrocketed from 183,107 to 5,750,000, marking a 3,040% increase. This surge points to a growing interest and trust in the Avalanche platform among users and investors.
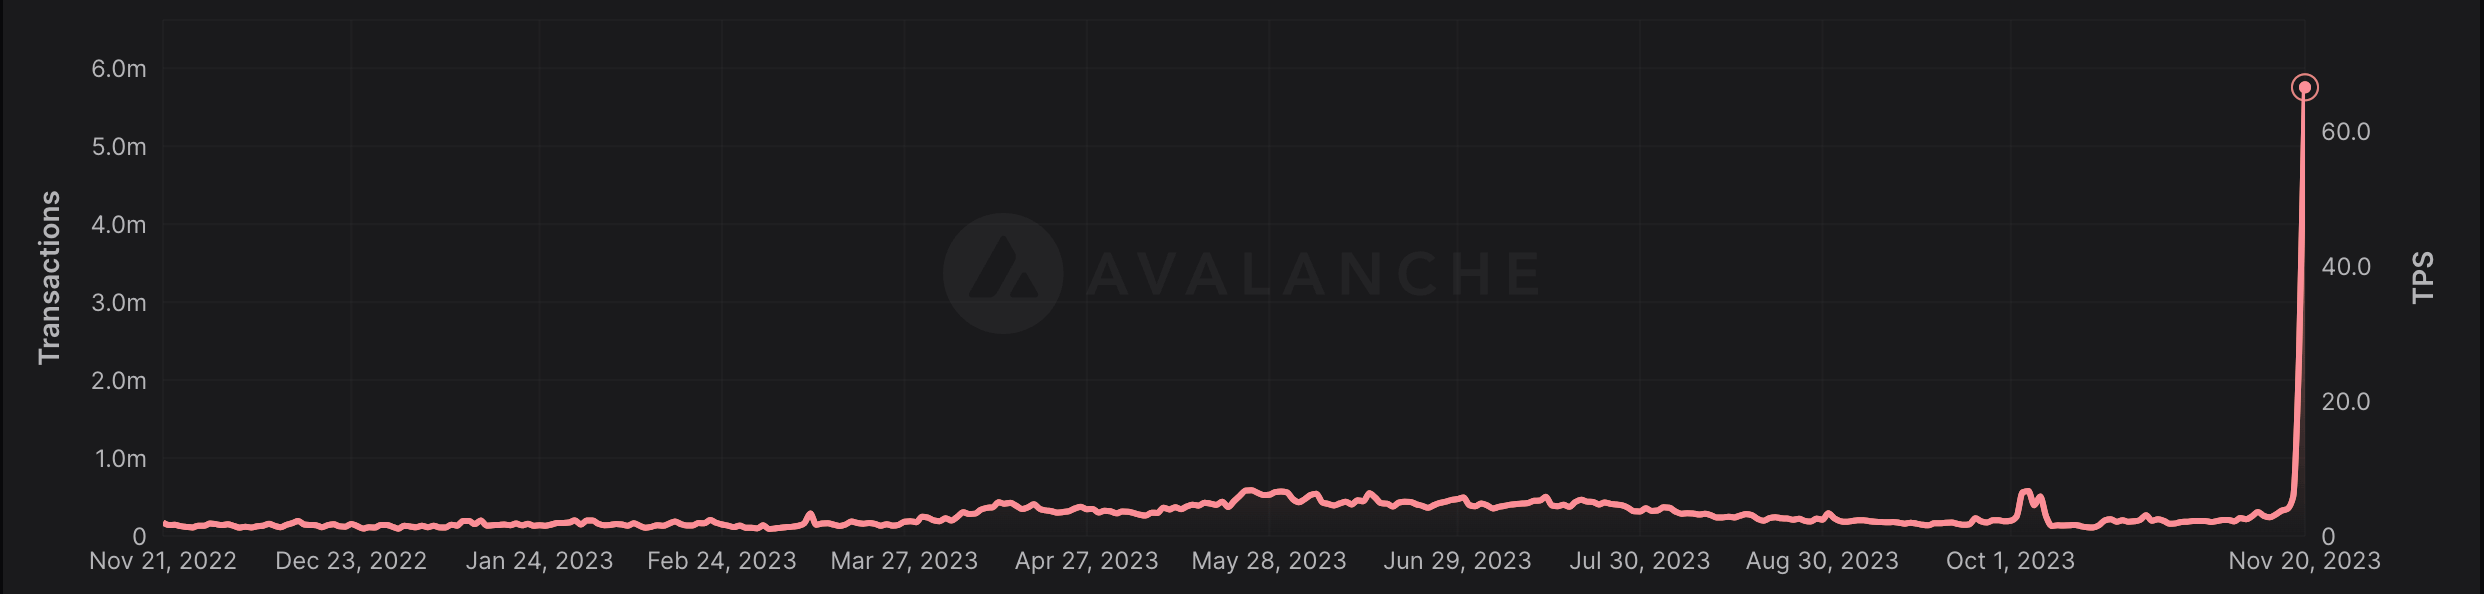
Alongside the rise in transaction count, there was a significant increase in the number of transactions per second (TPS) the network processed. This metric is a crucial gauge of a blockchain’s efficiency and scalability. The average TPS on Avalanche jumped from 2.24 on Nov. 1 to a peak of 66.61 on Nov. 20. This represents a remarkable ability of the network to handle increased throughput, showcasing its potential to support a high volume of transactions efficiently.
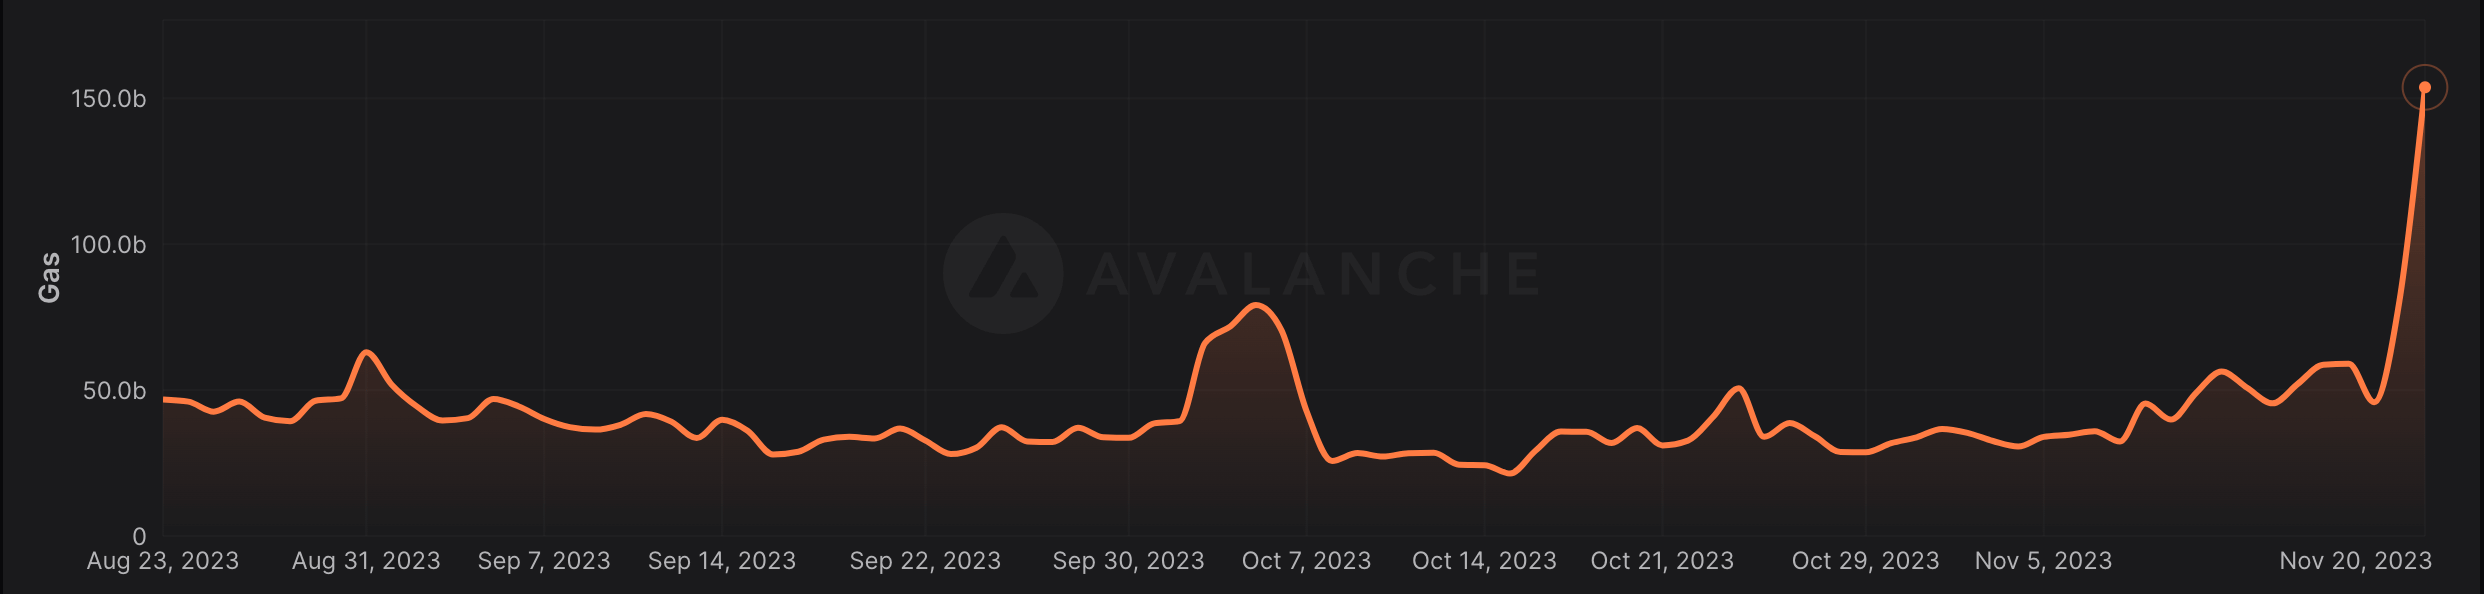
Another vital aspect to consider is gas usage, a measure of the computational effort required to execute operations on the network. Gas is essential to understand, as it reflects the network’s demand and the complexity of processing transactions. From Nov. 1 to 20, the gas used on Avalanche escalated significantly, from 36.7 million to 153.79 million, the second-highest level in the past year. This rise indicates not only increased activity but also possibly more complex transactions taking place on the network.
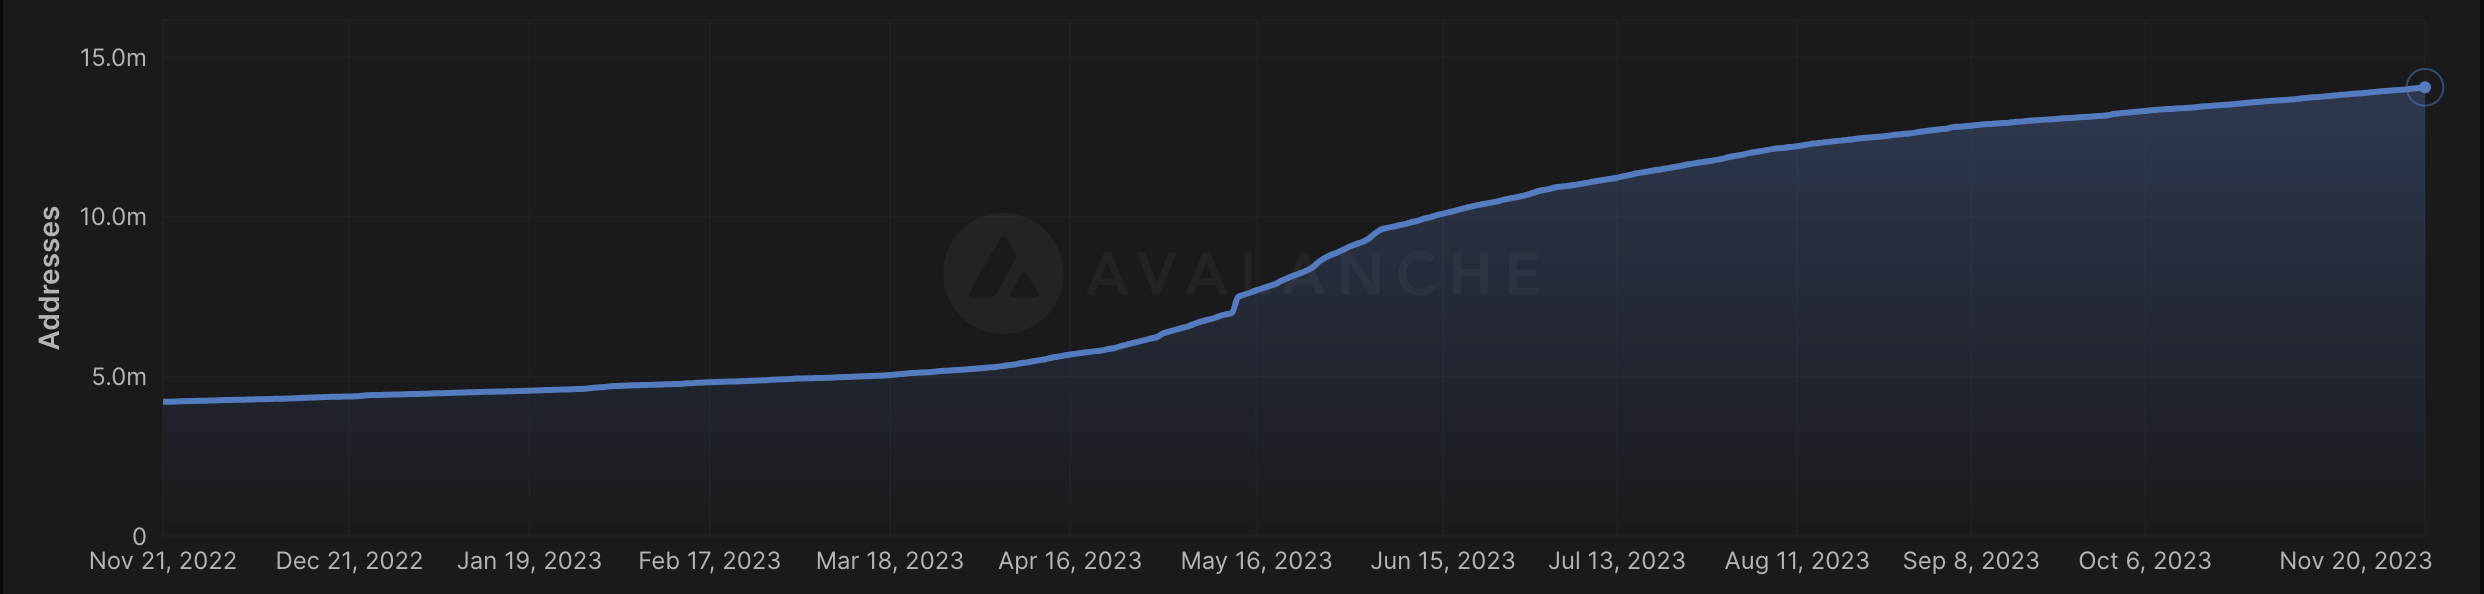
In addition to the surging transaction metrics, the total number of addresses on Avalanche also saw a noteworthy increase. This growth in addresses is indicative of the network’s expanding user base and adoption rate. The data shows a growth from 13.56 million addresses on Nov. 1 to 14.06 million on Nov. 20.
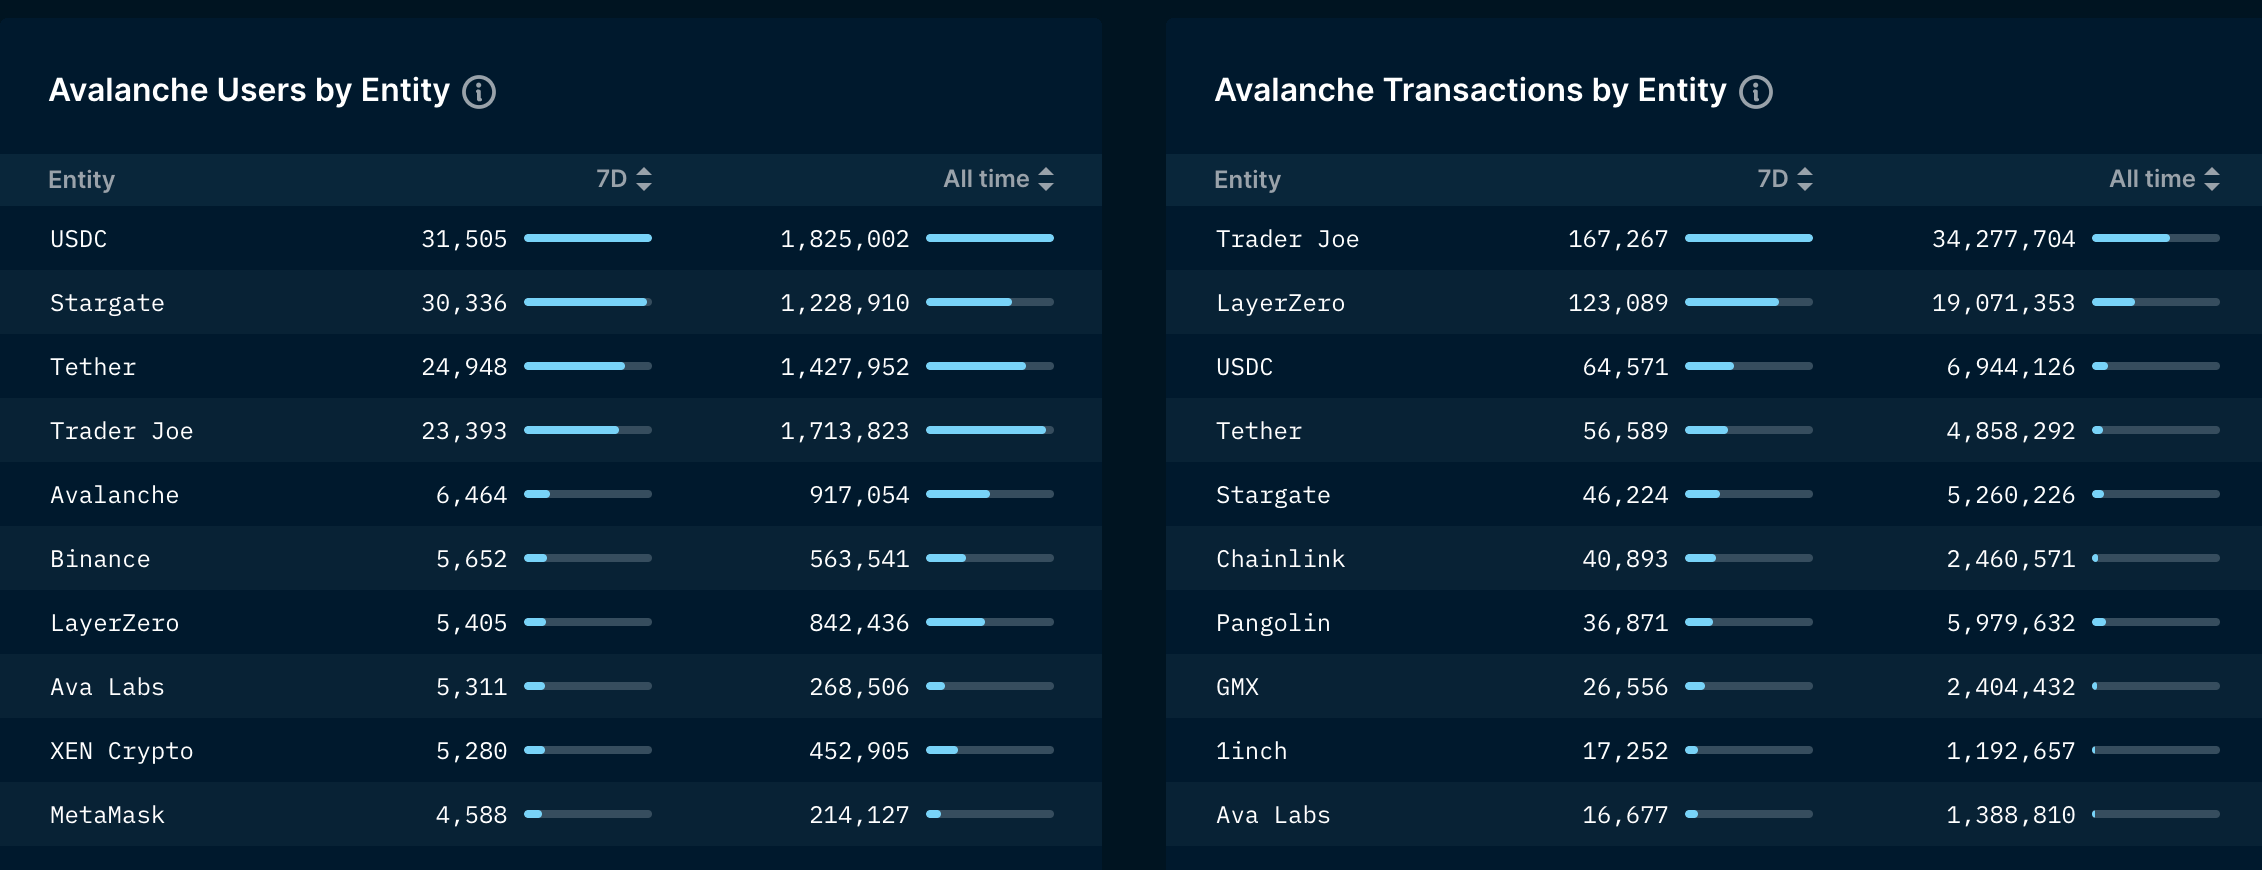
Focusing on specific entities within the Avalanche ecosystem, certain protocols have experienced heightened user interaction and transaction volume. For instance, USDC and Trader Joe have seen the highest number of users and transactions. Such entities play a pivotal role in the ecosystem, offering services ranging from stablecoin transactions to decentralized trading.
These developments and the surge in on-chain activity correlate with recent advancements and initiatives in the AVAX ecosystem. Strategic partnerships, technological enhancements, and expansions across various sectors likely drive this surge.
The post Transactions on Avalanche surge by 3,040% in November appeared first on CryptoSlate.