Ethereum sees major shift from centralized exchanges to DeFi
A key aspect of the Ethereum ecosystem is its distribution and activity across centralized (CEX) and decentralized exchanges (DEX). Analyzing this shift is crucial for grasping the market dynamics of the second-largest cryptocurrency and understanding its position.
There has been a notable decline in Ethereum’s presence on centralized exchanges this year. From a high of 20.23 million ETH on Jan. 1, the balance plunged to 14.21 million by Dec. 12, marking a 29.68% decrease. This trend mirrors Bitcoin’s withdrawal from exchanges but with a distinct Ethereum flavor, emphasizing a pivot towards DeFi rather than cold storage. The period from Oct.11 to Dec. 12 alone saw a 2.87% drop in ETH balances on CEXs.
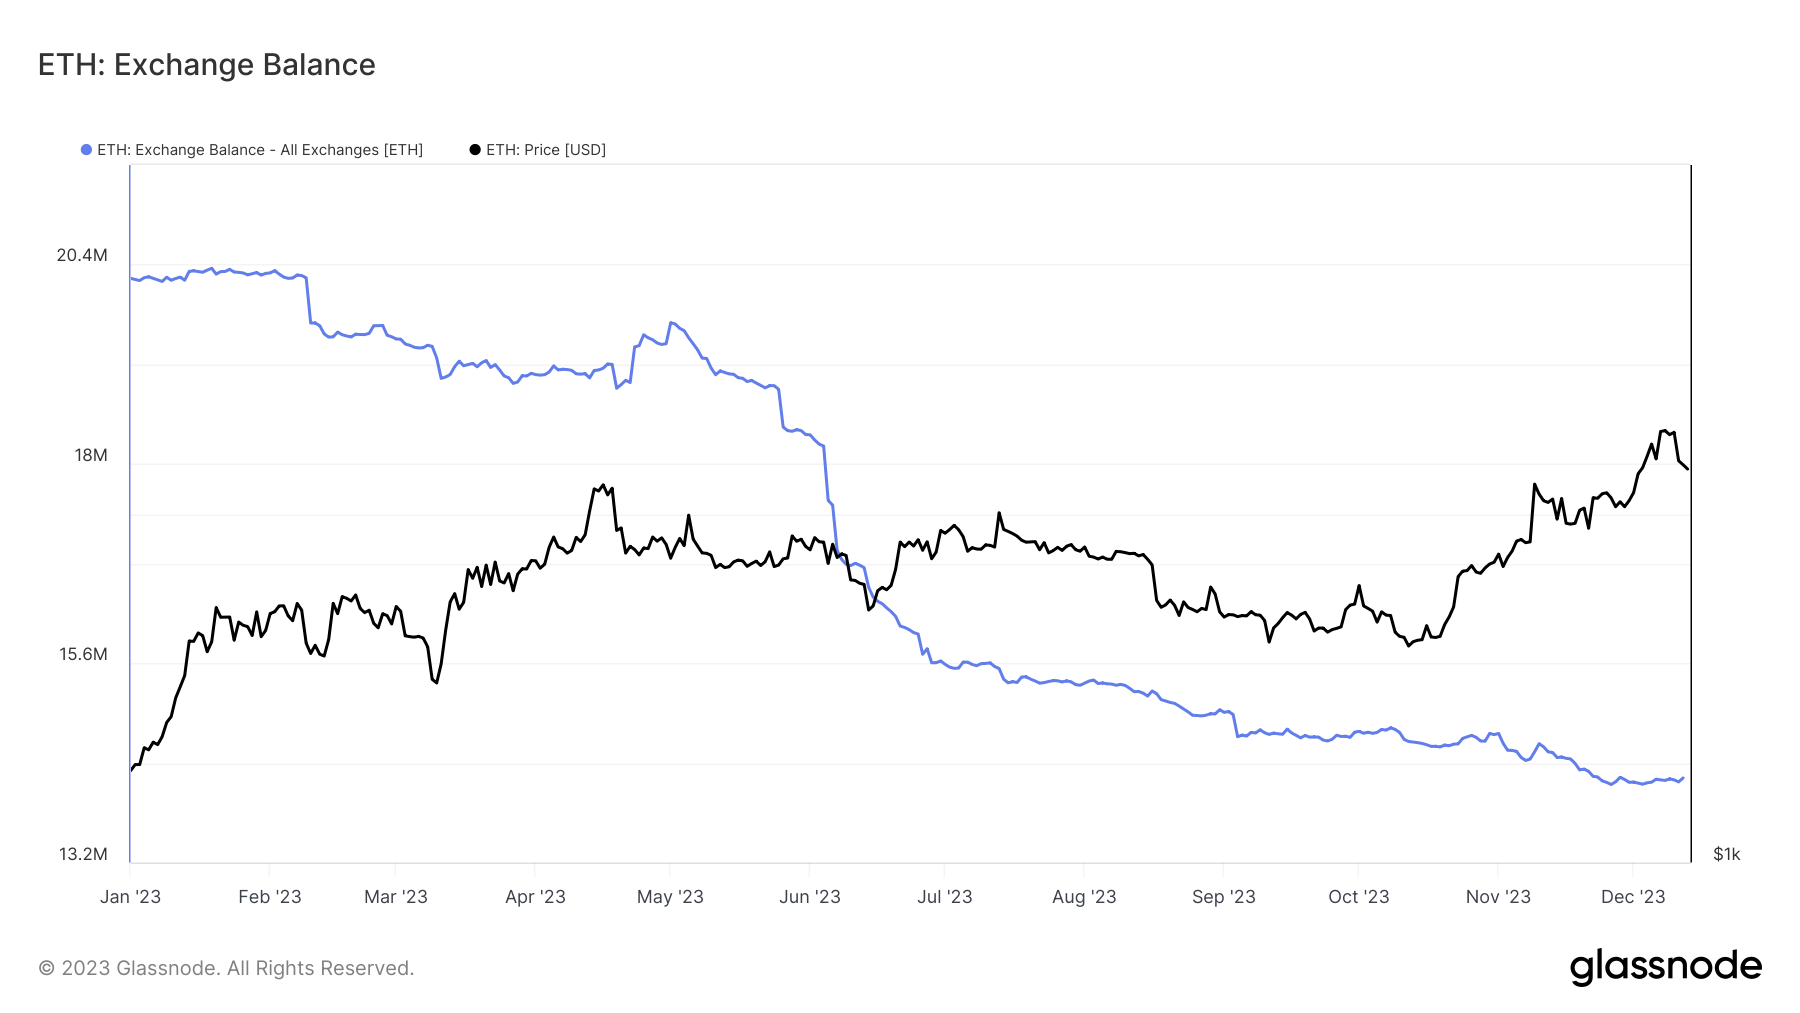
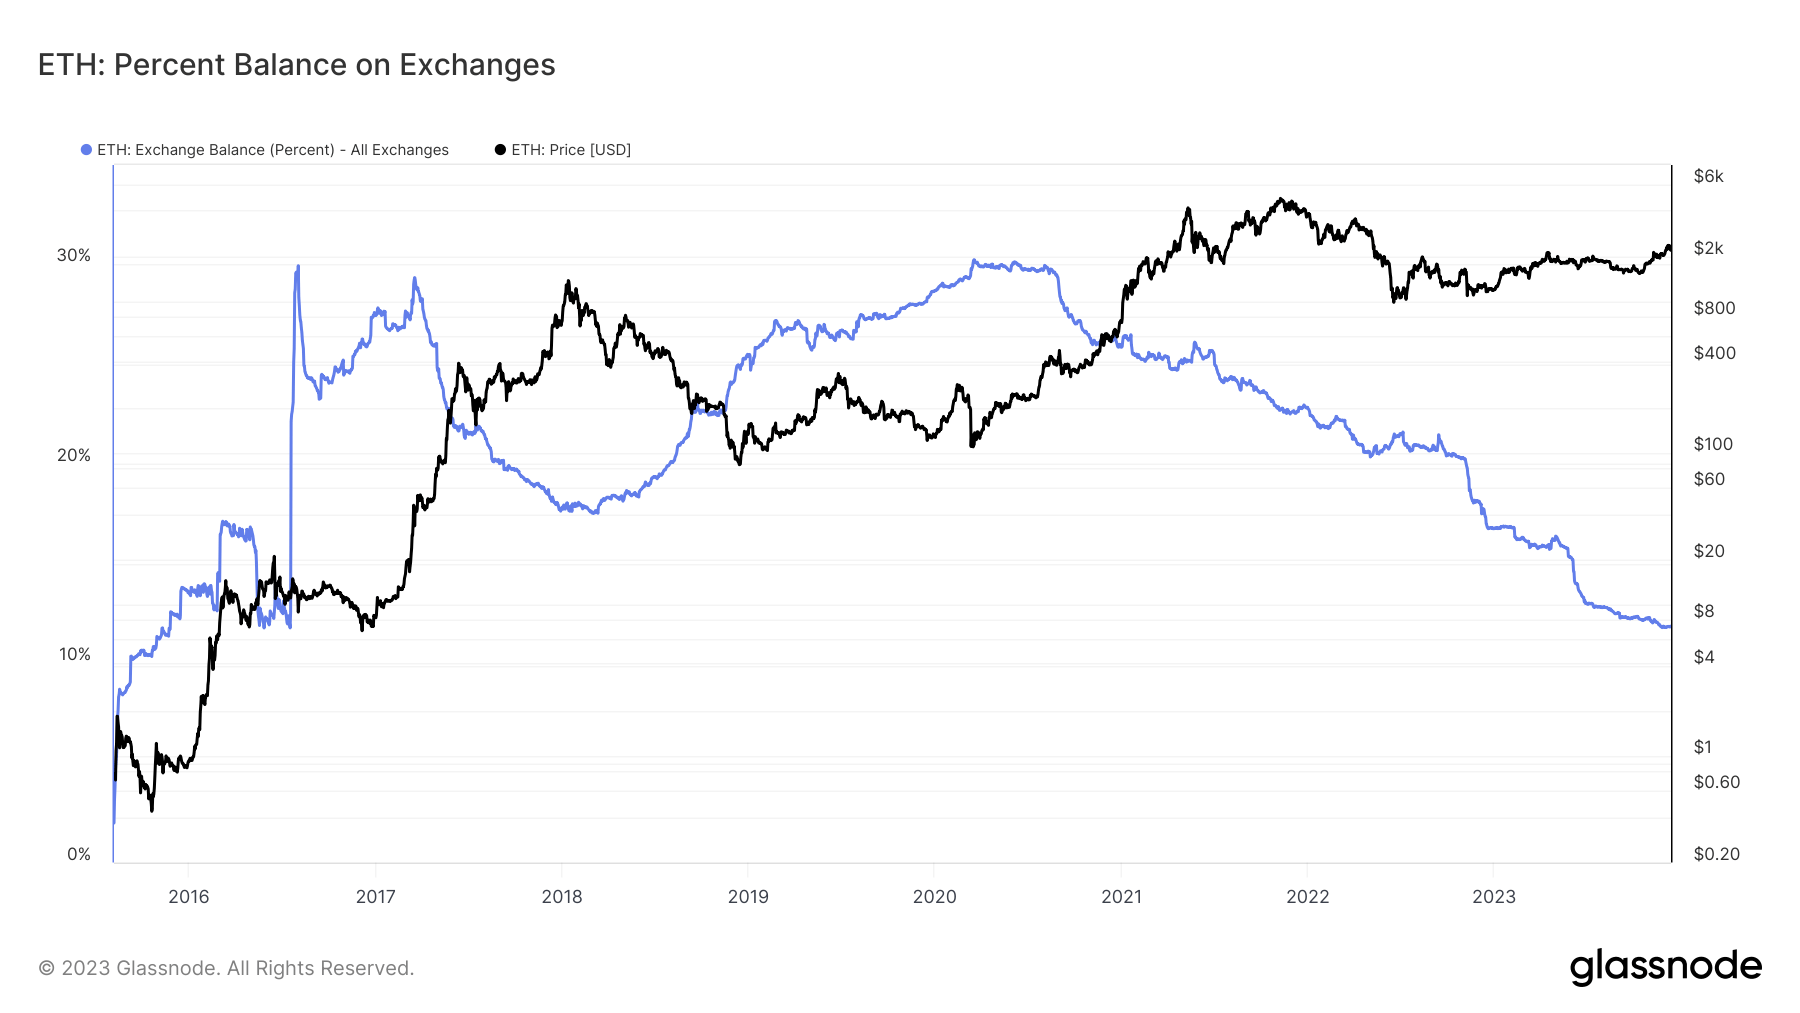
This decline in Ethereum supply on exchanges means that only 11.81% of Ethereum’s total supply remains on centralized platforms, the lowest since July 2016. This figure was significantly higher at 16.78% at the start of the year.
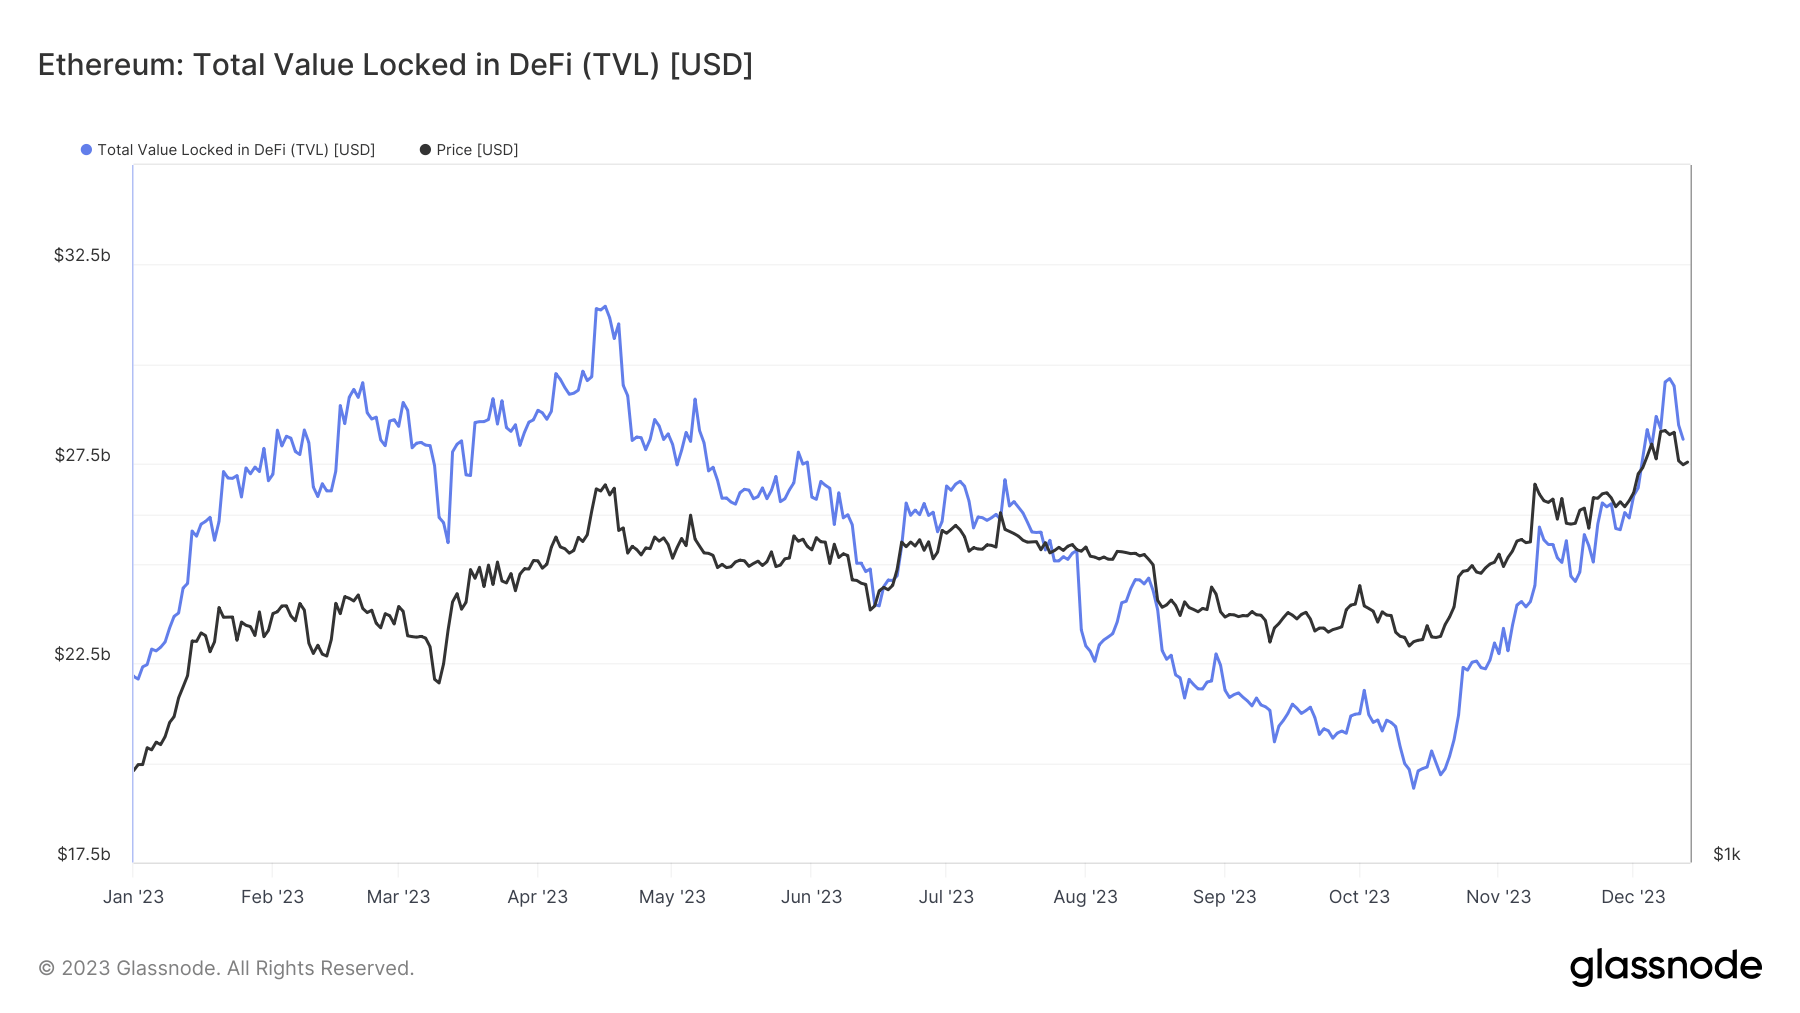
The data points towards a discernible shift in investor preference towards decentralized finance. This is highlighted by the substantial growth in Total Value Locked (TVL) within the Ethereum ecosystem, which soared from $22.16 billion at the beginning of 2023 to $27.63 billion by Dec. 12. This increase in TVL underpins a growing confidence and capital commitment in Ethereum-based DeFi.
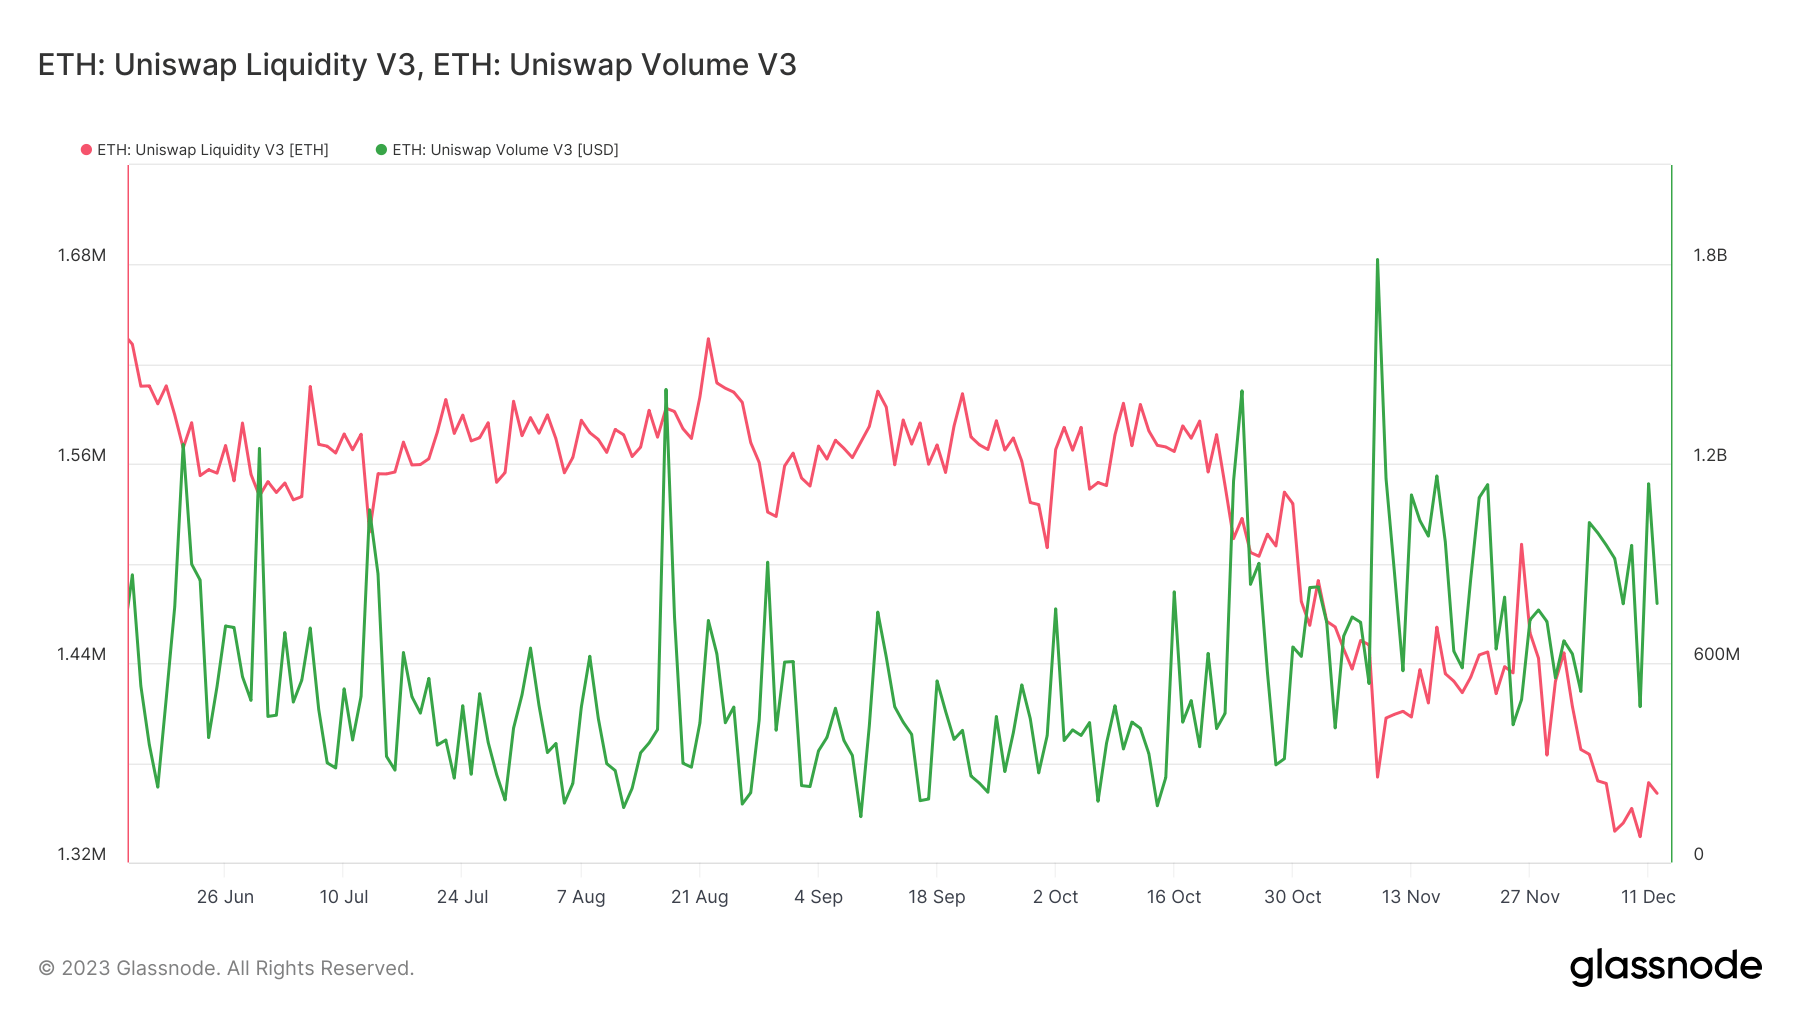
Focusing on Uniswap V3, the largest blue-chip platform on Ethereum, illustrates the growth the DeFi sector has seen. On Dec. 12, Uniswap recorded 353,544 ETH in trades and held a liquidity of 1.36 million ETH.
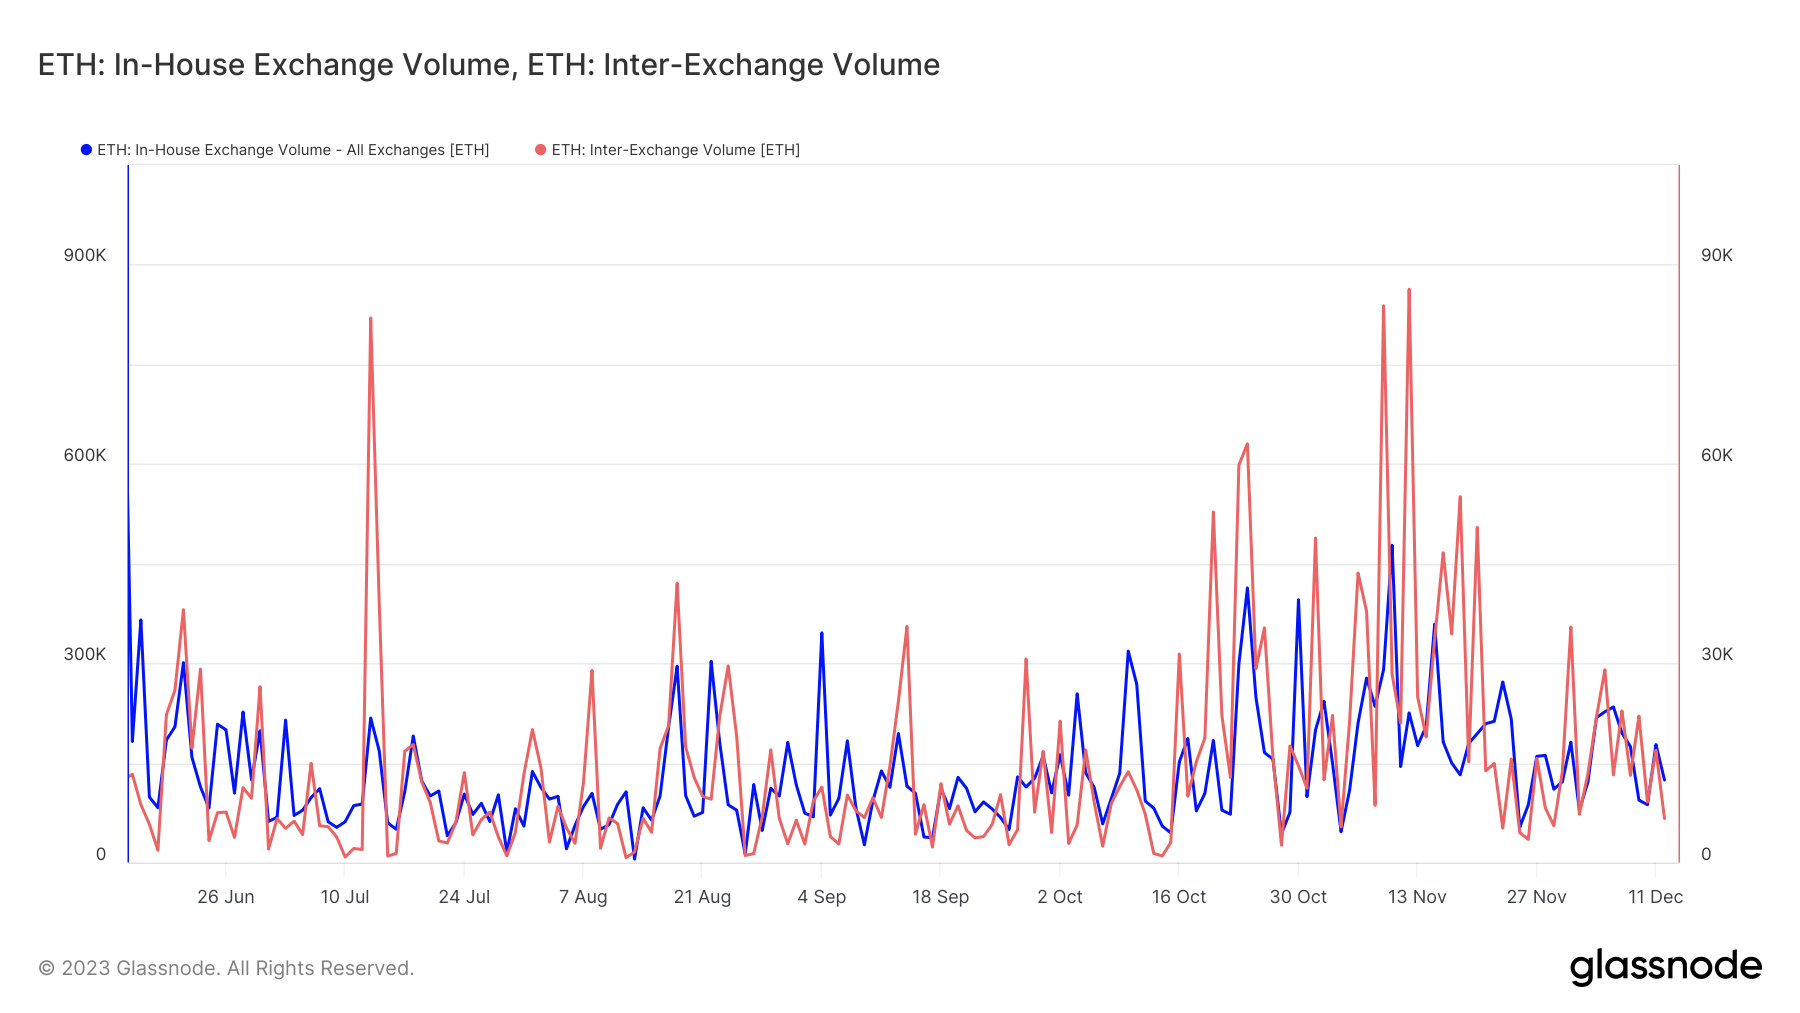
This activity on a single platform significantly overshadows that on centralized exchanges, where internal and intra-exchange ETH transfers reached 124,146 ETH and 6,627 ETH, respectively, on the same date.
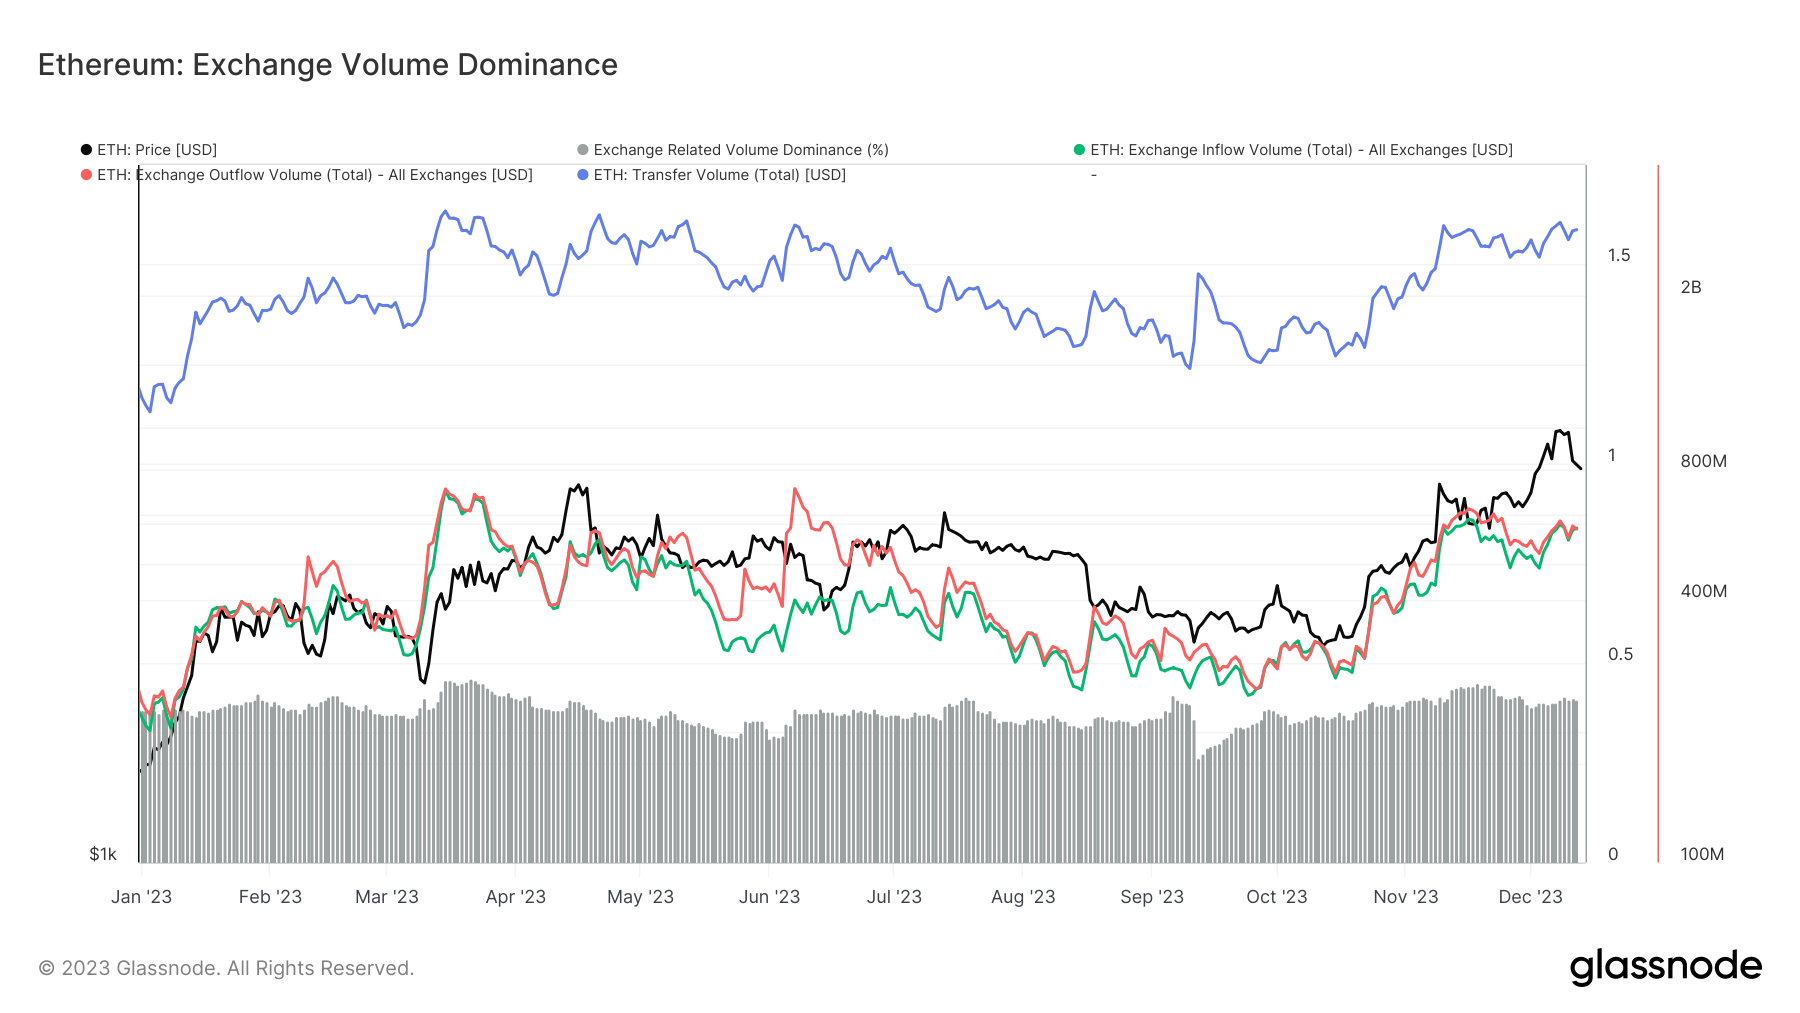
Another critical aspect is the relative dominance of ETH exchange inflows and outflows compared to the overall Ethereum transaction volume. This metric rose from 38.44% on Jan. 1 to 41.14% by Dec. 12, despite the overall reduction in exchange-held ETH. This indicates that Ethereum transactions on exchanges have become either more frequent or larger in volume.
In 2023, Ethereum saw a clear transition away from centralized exchanges. While the reduction in exchange-held ETH suggests a movement towards DeFi platforms or private wallets, the increased relative exchange inflow/outflow volumes indicate a more dynamic trading environment. The robust activity on Uniswap Version 3 further emphasizes the significant role of decentralized exchanges in the Ethereum market. Additionally, the growth in TVL reflects an escalating confidence and investment in the Ethereum-based DeFi sector.
The migration from centralized exchanges to decentralized finance points to a maturing market where investors increasingly engage with more complex and diverse financial products.
The post Ethereum sees major shift from centralized exchanges to DeFi appeared first on CryptoSlate.