GRT Price Prediction: Graph Prepares A Run Beyond $0.50

The post GRT Price Prediction: Graph Prepares A Run Beyond $0.50 appeared first on Coinpedia Fintech News
With a sharp rise in trend momentum, the GRT price is witnessing a trend reversal on the weekly charts. The skyrocketing trading volumes, the 78% jump within the last 20 days, and the overall optimism in the market fuel the bull run in the Graph token.
Despite the good times starting for GRT hodlers, the bears still hold critical forts at higher levels, like the psychological mark of $0.50. Will the GRT Price reach $1? For a more detailed approach to the potential price trend of The Graph, check out our GRT price prediction.
Weekly Reversal Sets The Graph For A Bull Run
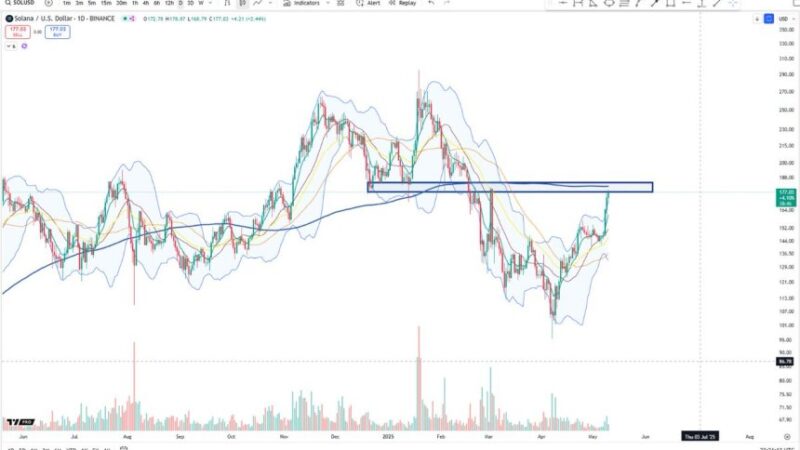
With a retest of the 50-week EMA, the GRT price takes off to form three consecutive bullish weekly candles. The sharp reversal accounts for a jump of almost 80% and challenges the $0.30 mark.
Source- Tradingview
Further, the $0.30 mark aligns with the 23.60% Fibonacci level that marks a critical bearish dominance. Hence, the breakout of this level will mark an excellent buying spot for sideline traders.
Currently, the GRT price trades at $0.2738 with an intraday fall of 2.41%, as a pullback of the 12.78% jump last night.
Will The GRT Price Break Past $0.50?
Despite the GRT price being at a discount of 90.55% from the all-time high of $2.88, the trend reversal revives the hope of a new all-time high. However, the long road ahead has multiple bearish pit stops that may lead to intense pullback along the way.

Currently, the GRT price faces a similar bearish stop at the confluence of the overhead resistance trendline and the $0.30 mark. However, the 78% rise in trading volume supporting the bull run projects a high breakout possibility.
In such a case, the breakout run could surpass the $0.50 psychological mark for a quick jump to $0.68.
Technical Indicators:
DMI Indicator: The rising ADX line and the positive alignment of the VI lines reflect increasing bullish momentum.