Toncoin Price Analysis: TON Shows Bullish Momentum After Pantera Capital Investments


The post Toncoin Price Analysis: TON Shows Bullish Momentum After Pantera Capital Investments appeared first on Coinpedia Fintech News
Following a surge past key resistance levels, Toncoin (TON) demonstrated bullish momentum after the investments from Pantera Capital announced its investment in the layer-1 altcoin.
Current trading at TON is trading $5.69 with 24-hour growth of 4.11 % and 7.37% in 7 days. Toncoin with a 24-hour market cap of USD 19.76B, ranks 9th on the Coinpedia market and 24 volumes of USD 270.21M.
Toncoin caught Pantera capital attention
Initially launched by the Telegram messaging platform, the cryptocurrency parted away from Telegram ahead of a legal battle with the US SEC. The asset technology management was further taken over by a group of open-source developers called ’Open Network’.
The Toncoin integration with the telegram app continued, wherein the telegram users can transfer the asset internally without the use of an address. Ryan Barney, a Pantera capital partner expressed how the Telegram network’s large active userbase has promoted crypto to millions. He further emphasized the potential of telegram to become the biggest crypto network.
TonCoin Technichal analysis
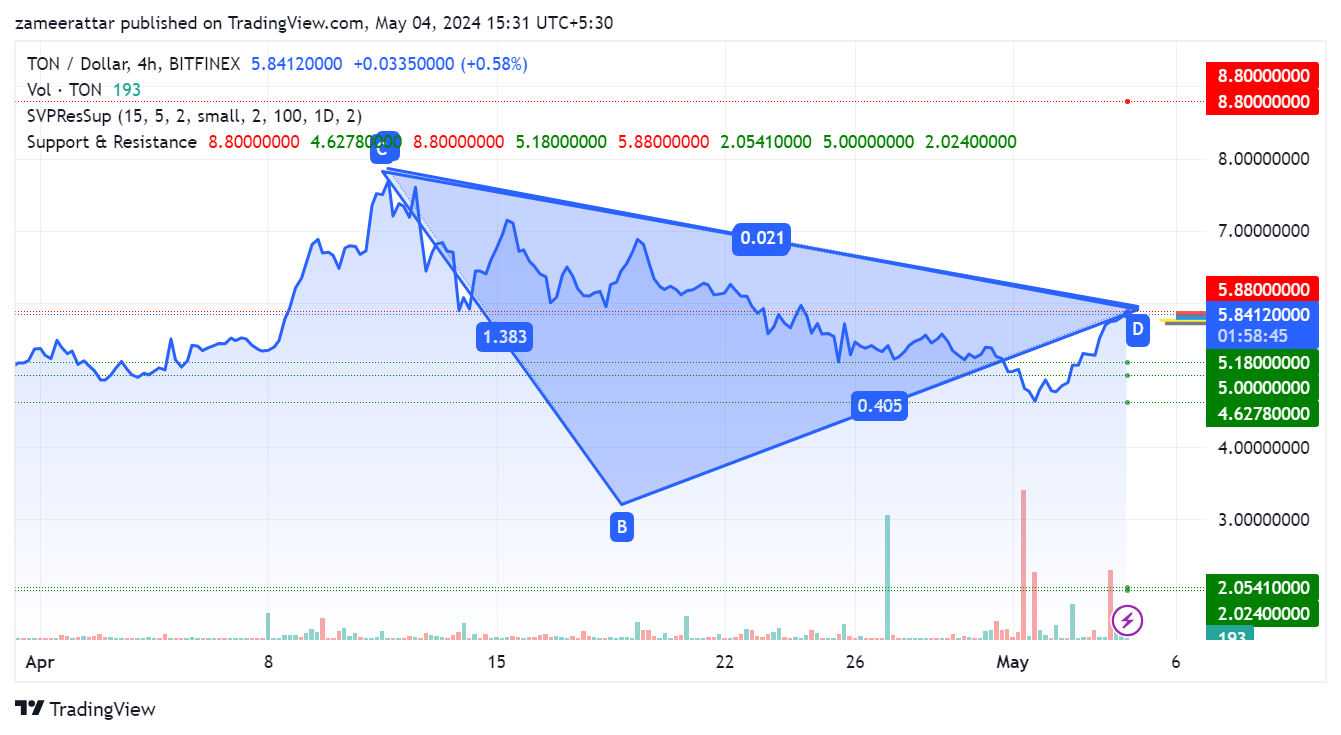
Key Support Levels: $5.50, $5.20
Key Resistance Levels: $6.00, $6.50
The crypto responded positively to the Pantera capitals investment news trashing the negative momentum earlier where the support of $5.20 was broken on May 1 and hit a low of $4.67
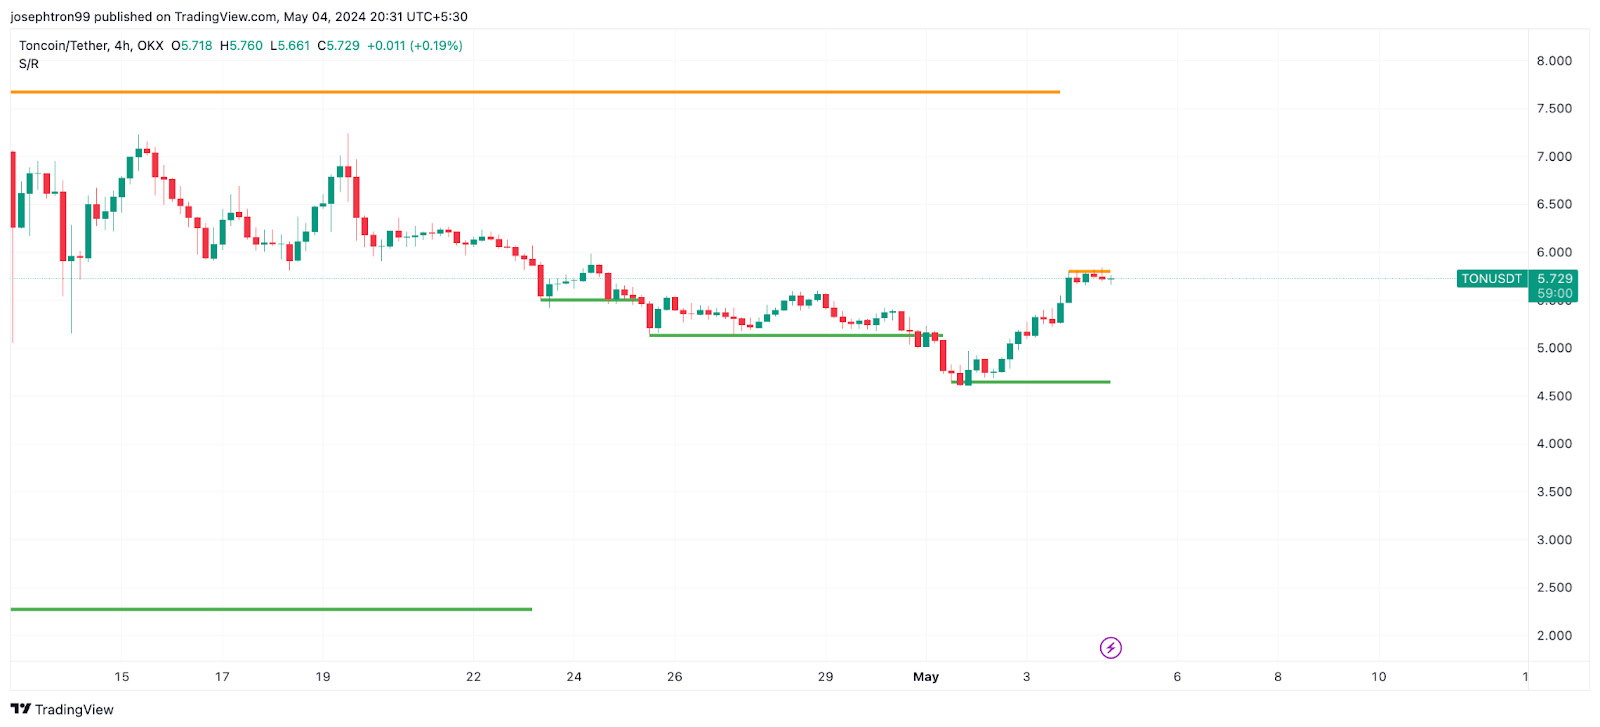
Toncoin’s price action has been notably bullish, with the cryptocurrency surpassing key resistance levels in recent trading sessions. Despite initial hesitation from buyers, Toncoin has continued its upward trajectory, reaching $5.80 today on major exchanges. The previous resistance at $5.50 has now turned into support, with the next significant resistance level identified at $6.00.
Technical Indicators:
- Volatility: The volatility is relatively high at 6.35%, indicating a relatively stable price movement.
- Relative Strength Index (RSI): The RSI stands at 38.82, suggesting that TON is in neutral territory in terms of overbought or oversold conditions.
- MACD (Moving Average Convergence Divergence): The MACD is slightly negative at -0.35, indicating some downward pressure.
Bias:
The current bias for Toncoin is bullish, supported by positive market sentiment. However, there are indications of weakening momentum, particularly with decreasing trading volume. The resistance level at $6.00 may present a challenge for further price appreciation.
Short-Term Price Prediction for TON:
Although Toncoin has surpassed $5.80, recent price action indicates the potential for a reversal if selling pressure intensifies. The decline in momentum and low trading volume raise concerns, but the overall market sentiment favors bulls. Should Toncoin’s price continue to rise, the next significant resistance level is anticipated at $6.00.
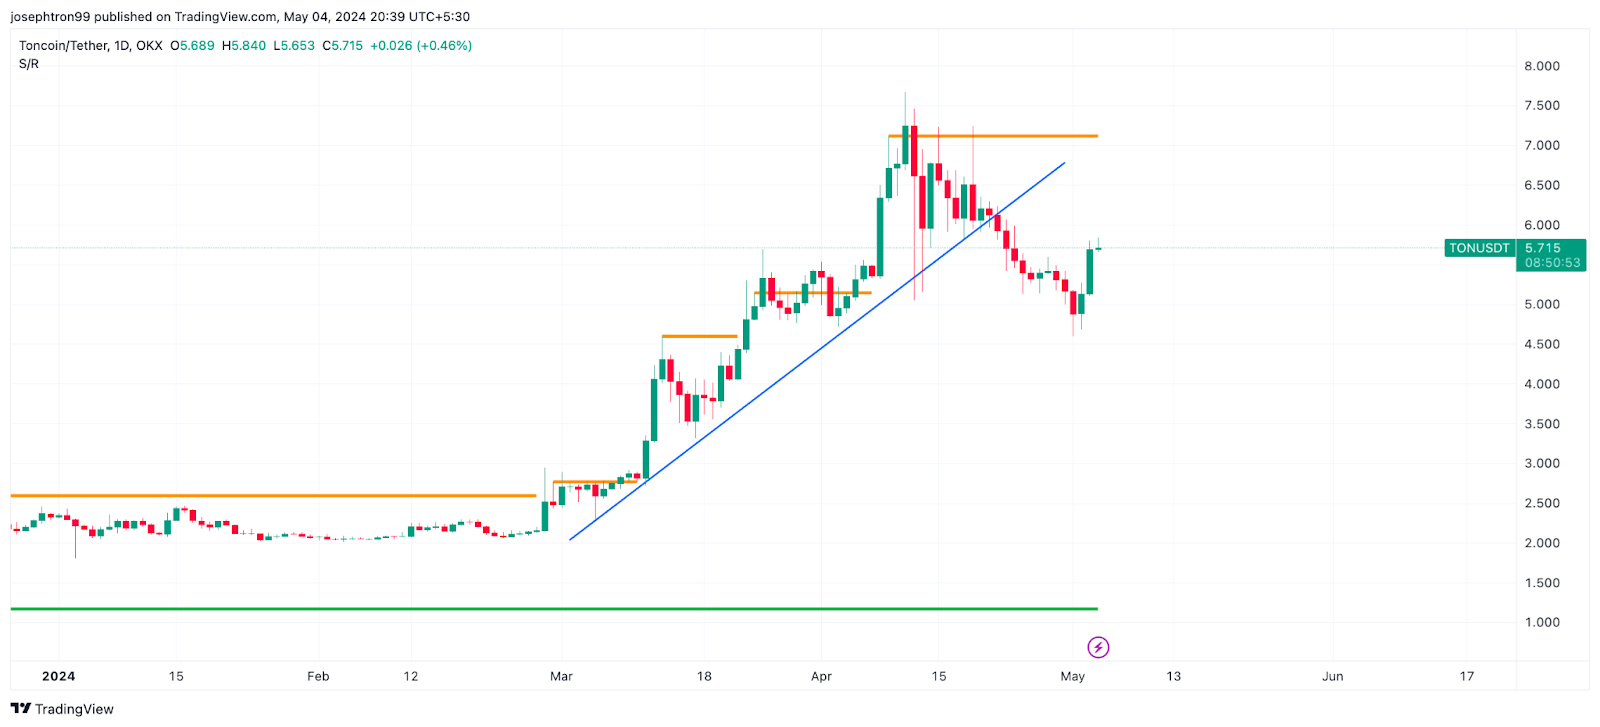
The price recovery from two weekly candles closing bearish to creating new resitances in impressive. The analysis also suggests the price could potentially test the ascending trend line and may hit near the all-time high of $7.61 which as created on April 11.
In conclusion, Toncoin demonstrates bullish momentum amid positive market sentiment. However, investors should closely monitor key technical indicators and market developments for insights into potential future price movements.