Why is the Crypto Market Down Today? Analyzing the Key Factors


The post Why is the Crypto Market Down Today? Analyzing the Key Factors appeared first on Coinpedia Fintech News
A majority of major cryptocurrencies witnessed heightened volatility this week as a wave of market news floods investors with uncertainty. From the early week’s U.S. CPI and PPI data, negative inflow in spot ETFs, and Bitcoin miner capitulation, the crypto investors faced a series of developments that led BTC price to a four-week low of $65078. Will this correction be extended for the second half of June?
Bitcoin Faces Bearish Pressure Amid Miners’ Capitulation and Long-Liquidation
Source-Tradingview
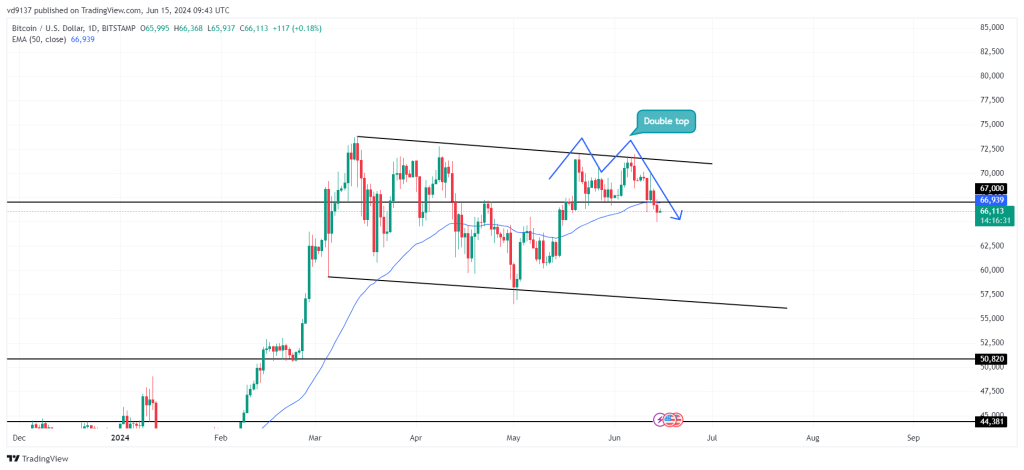
Over the past three months, the Bitcoin price has traded sideways resonating within two parallel-walking trendlines of daily charts. On June 7th, the BTC price witnessed its latest reversal from the overhead resistance at $71000, leading 8.37% to $66114.
The downfall was initially accelerated by Pre-CPI Data uncertainty among traders, which failed to recover despite lower-than-expected inflation.

As per the recent data from Coinglass, Bitcoin investors have experienced notable long liquidation over the past four days. The notable green bars in the Total Liquidations Chart show the buyers faced a $163.8 Million liquidation, which accelerated the bearish momentum.
Currently, the BTC miners’ capitulation is among the major factors contributing to the falling prices. As per a recent tweet from CryptoQuant’s CEO Ki Young Ju, the 18-month uptrend in Bitcoin’s hashrate has come to a halt, hinting at possible miner capitulation. This decline in hashrate suggests the miners dumping BTC to bear the operation cost after the Fourth halving.
Reversal Pattern Emerged as Bitcoin ETFs Record Significant Outflows
In addition, the spot Bitcoin ETFs have witnessed net outflows in four of the past five days this week. On Friday, the Spot ETFs recorded a substantial outflow of $190 million, indicating a cautious approach from investors amid the current correction trend.
An analysis of the daily chart shows the Bitcoin price developed a bearish double-top pattern utilizing the supply pressure at the $71000 ceiling. This chart pattern commonly spotted at major and local market tops indicates renewed selling pressure among investors after a substantial rally.
With a 1.1% fall on Friday, the BTC price breached the $66730 neckline support and the 50-day EMA slope. The daily RSI slope also plunged below the 50% midline indicating that term market sentiment turning bearish. If the breakdown sustains, the sellers could lead another 6.5% fall to hit the $61500 mark.
Even with this potential downfall, the leading digital asset holds above the healthy retracement level of 23.% indicating the buyer holds a firm grip over this asset.
Final Takeaway:
The Bitcoin price is barely 10% down from the all-time high of $73750. As per the record, a 20-30% is still normal for the volatile asset BTC which allows it to recuperate the exhausted bullish momentum. This broader trend remains positive and the current correction allows investors to hunt for dip opportunities.
Also Read: The Crypto Markets Continue to Drop While Institutions Accumulate ETFs: Who Is Selling BTC?