Polkadot Price Analysis: Is DOT in Danger of Falling Toward $5 Soon?
Polkadot’s price has experienced heightened selling pressure, leading to a breakout below the significant $6 support region.
This development indicates a bearish sentiment in the market, with the potential for a continued downward plummet.
Technical Analysis
By Shayan
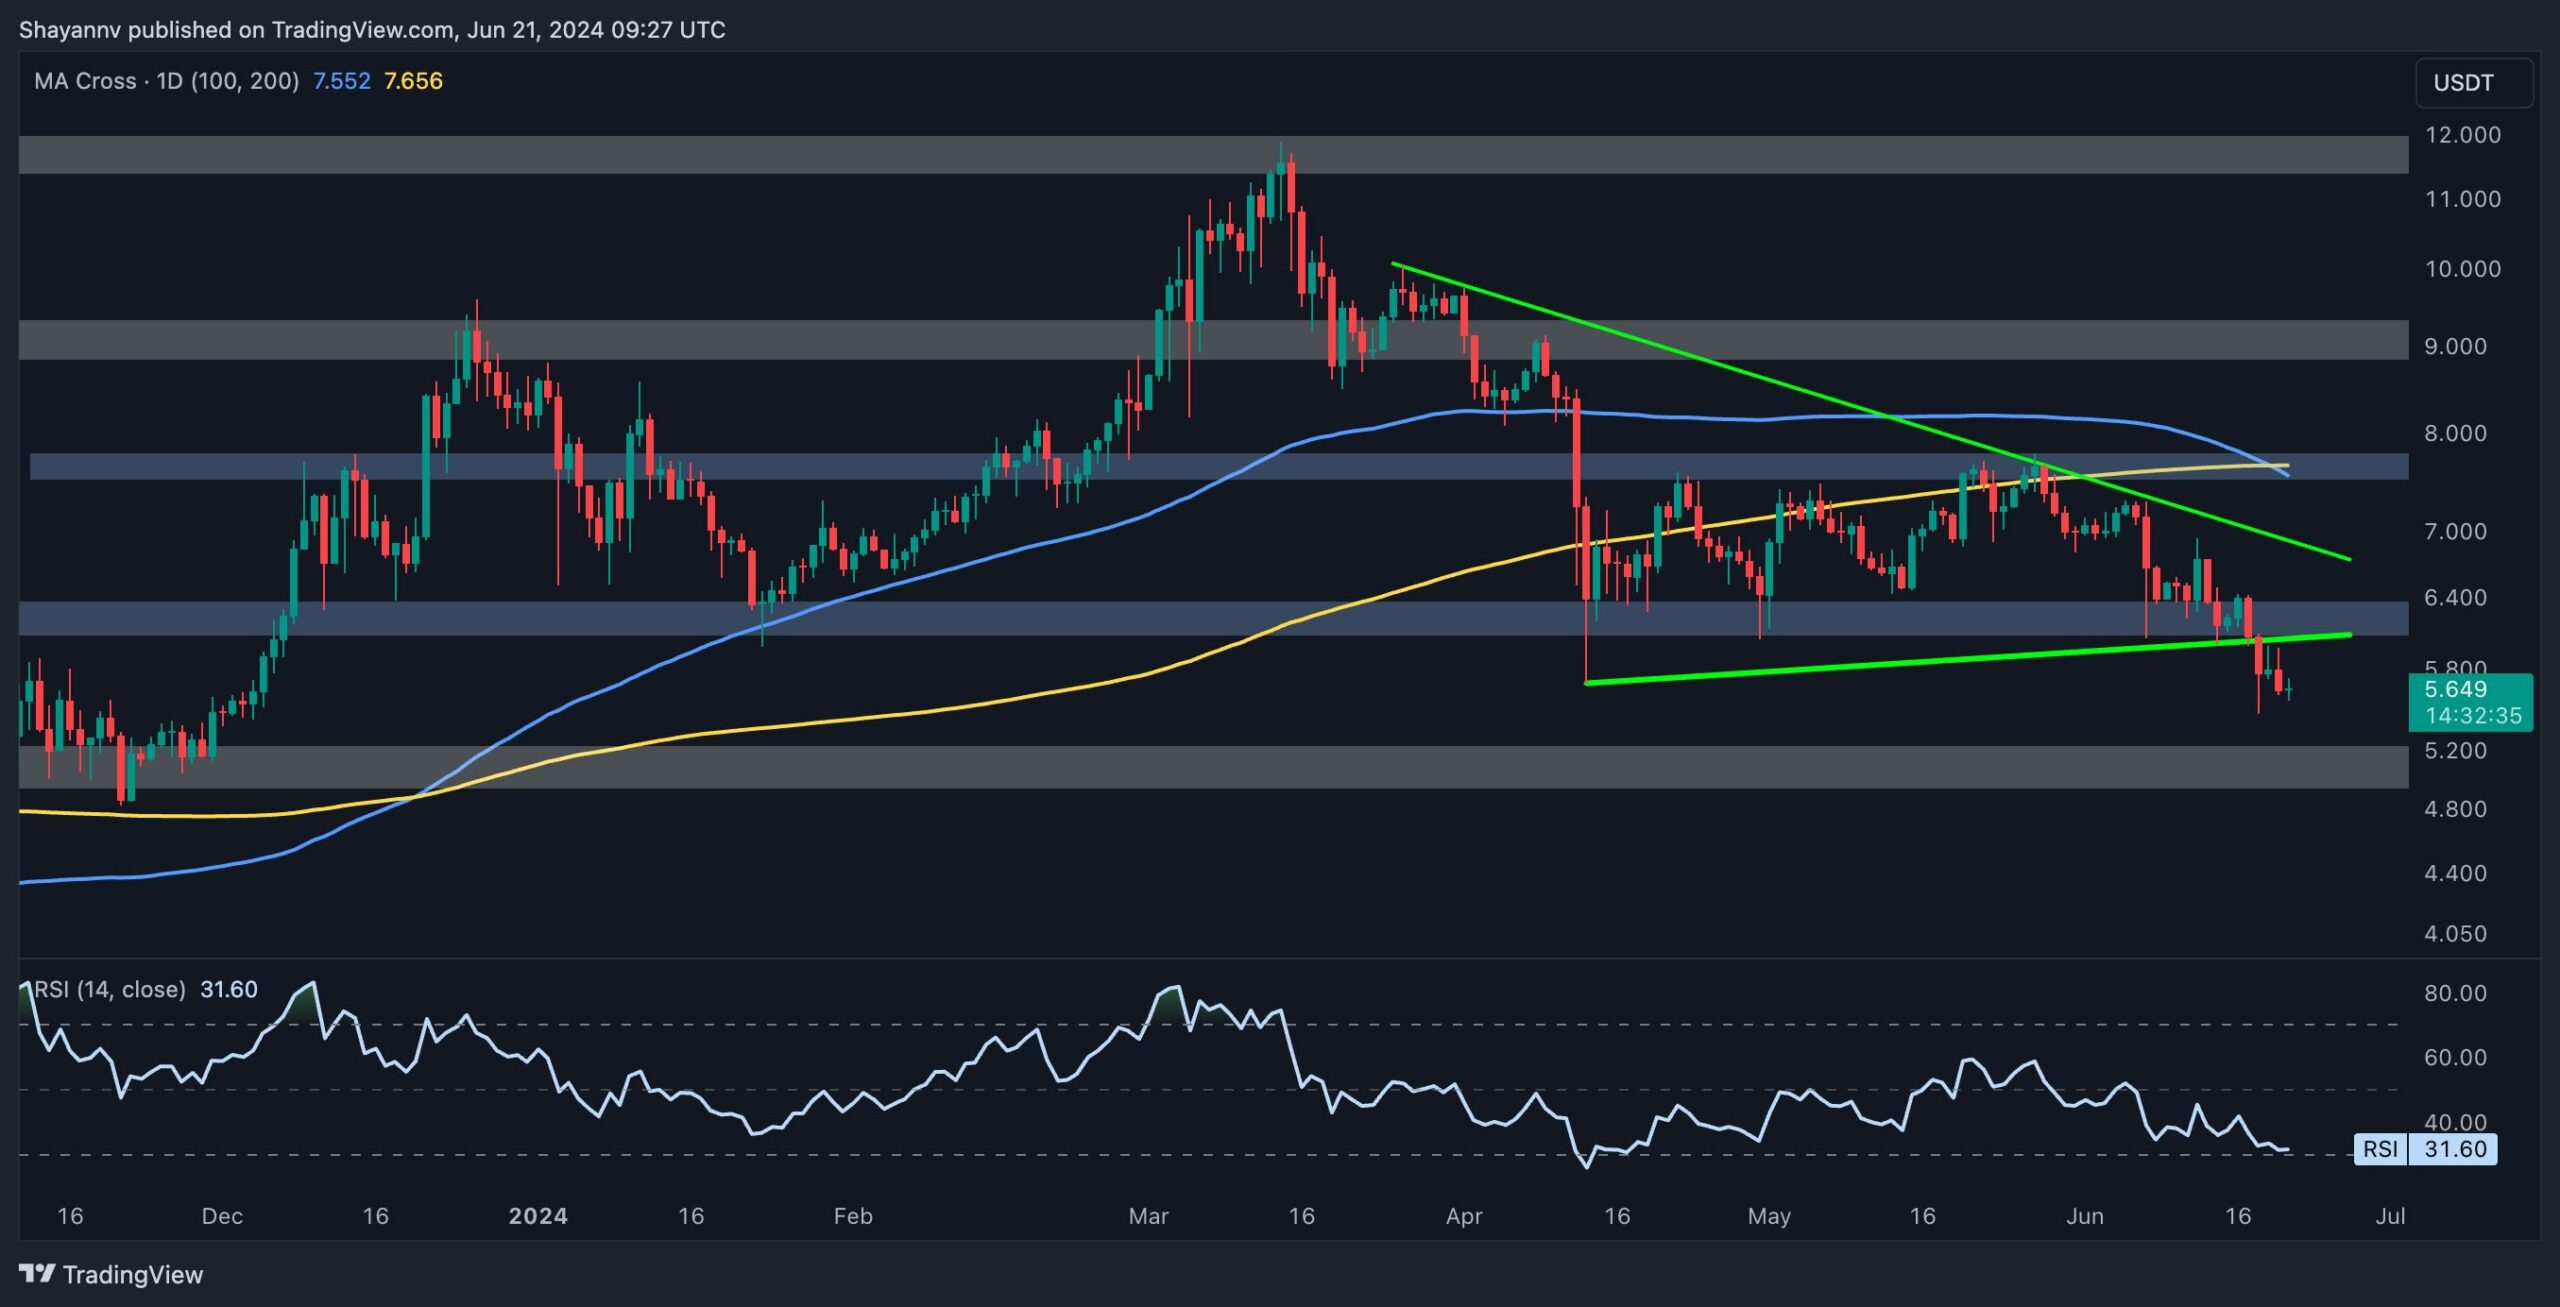
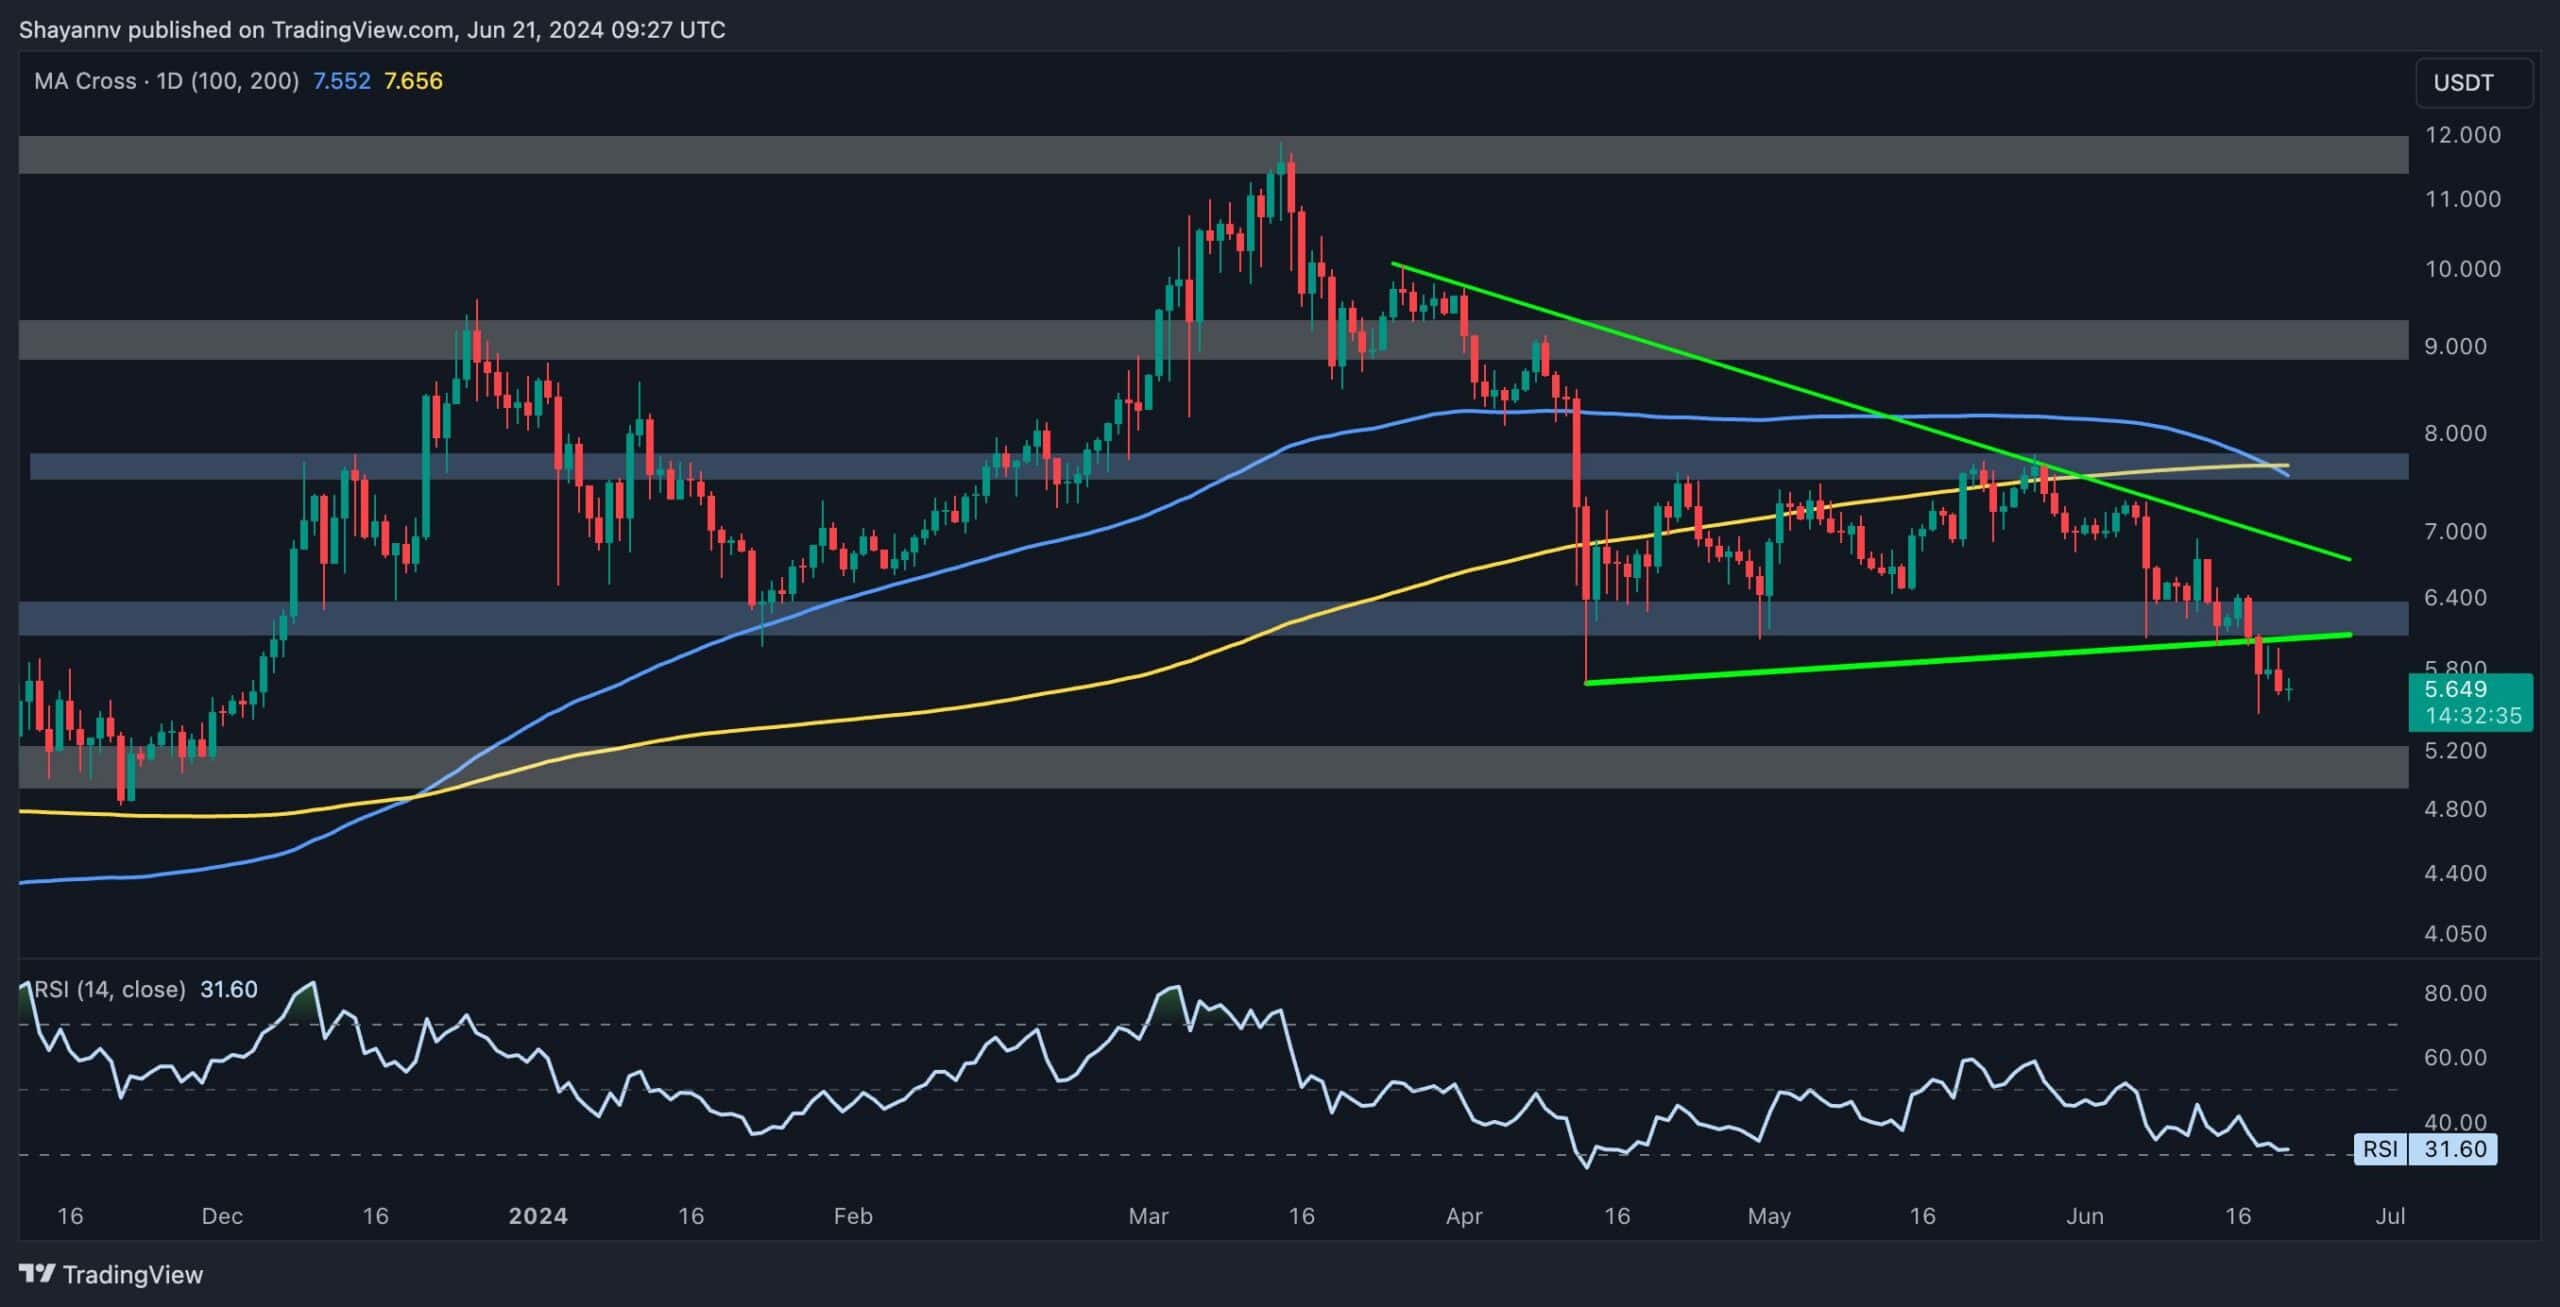
The Daily Chart
The daily chart reveals that DOT has faced aggressive selling near the critical $6 support region, resulting in a notable breach of this decisive support level. T
his underscores the intense selling pressure in the market, and it’s worth noting that it is not isolated to DOT but rather all altcoins. The price has broken below the lower boundary of a multi-month triangle and previous major swing lows, signaling a notable bearish sentiment.
Additionally, the 100-day moving average has crossed below the 200-day moving average, signaling a death cross. This development further indicates a bearish sentiment prevailing. Given this context, the price will likely decline toward the substantial $5 support region and may experience a period of consolidation around this level.
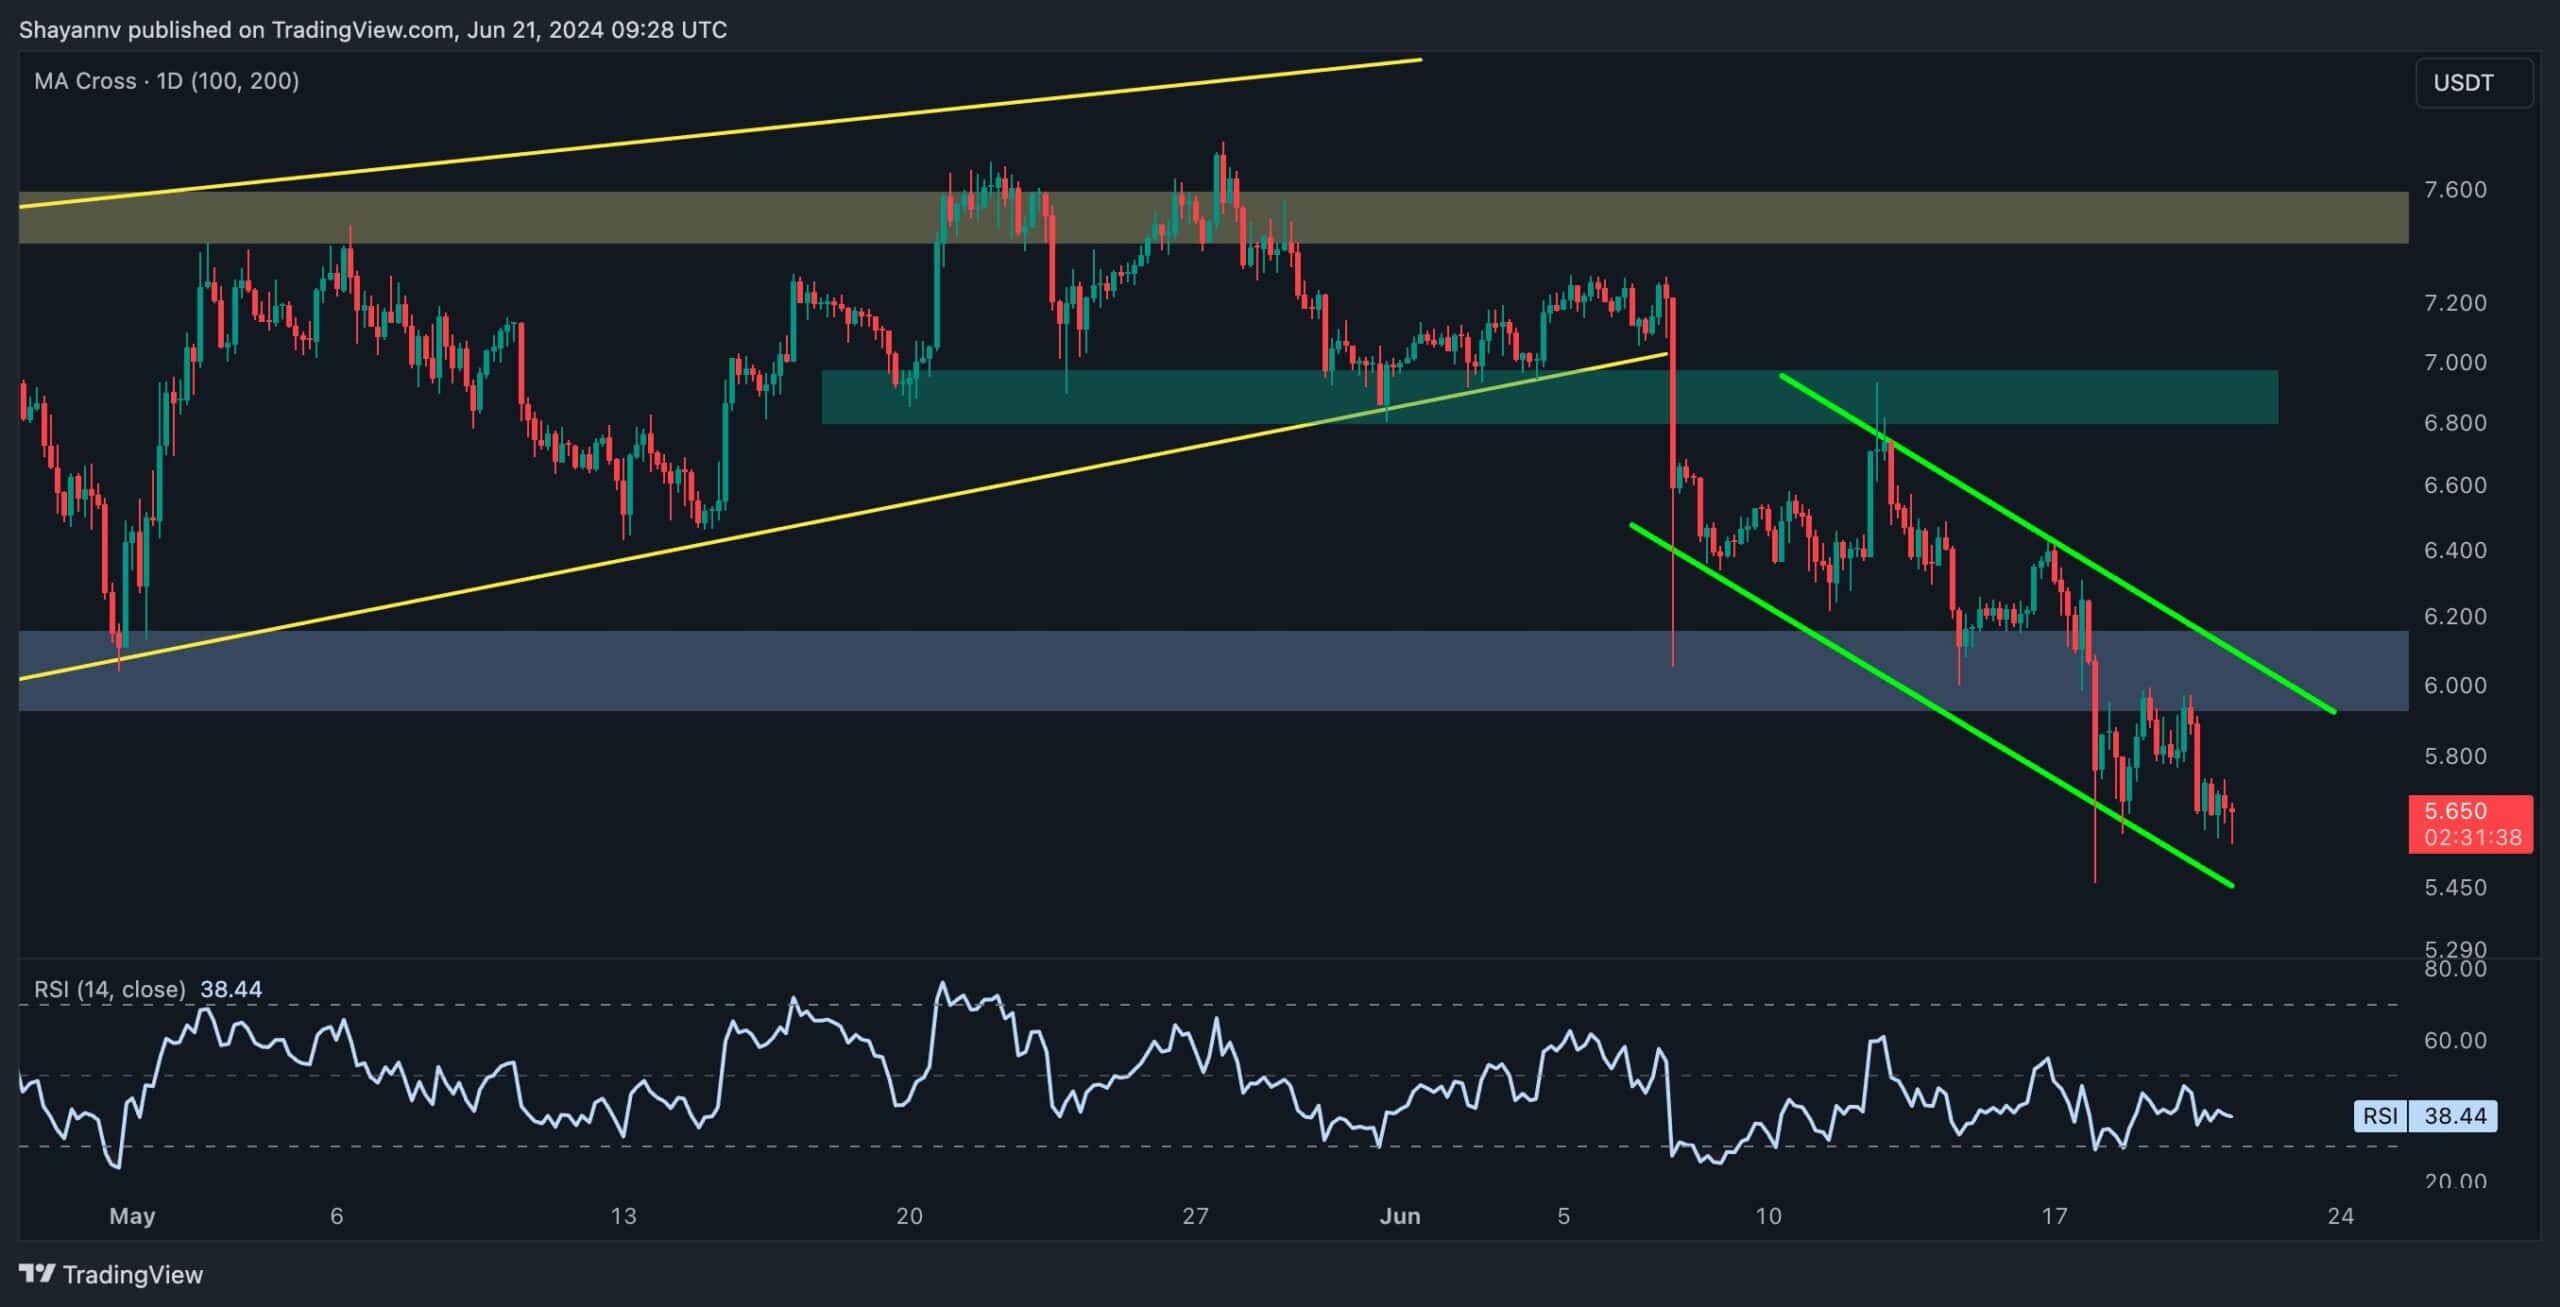
The 4-Hour Chart
On the 4-hour chart, DOT experienced heightened selling activity, which resulted in bearish retracements. These retracements have led to the formation of a bearish price channel, with the cryptocurrency currently hovering around its lower boundary.
Following the break below the crucial $6 threshold, the price completed a pullback to the broken level, further validating the bearish scenario.
DOT is expected to face heightened volatility in the short term and continue retracing toward the crucial $5.4 support. On a broader scale, a period of consolidation between the $5.4 and $6 levels is anticipated in the mid-term.
Sentiment Analysis
By Shayan
Following the recent break below the crucial $6 support region, Polkadot’s price has triggered a significant long-squeeze event, liquidating a notable number of long positions. This development is crucial for understanding potential future movements in the market.
The accompanying chart illustrates the potential liquidation levels in Polkadot’s price action, providing insights into where smart money might focus in the mid-term. Currently, there is a significant amount of liquidity resting near the $6 mark, likely comprising buy-stop orders from aggressive short positions initiated near this critical threshold.
In the event of a bullish correction, the $6 mark will be a primary target for buyers aiming to capitalize on liquidity and potentially complete a pullback to the previously broken support level.
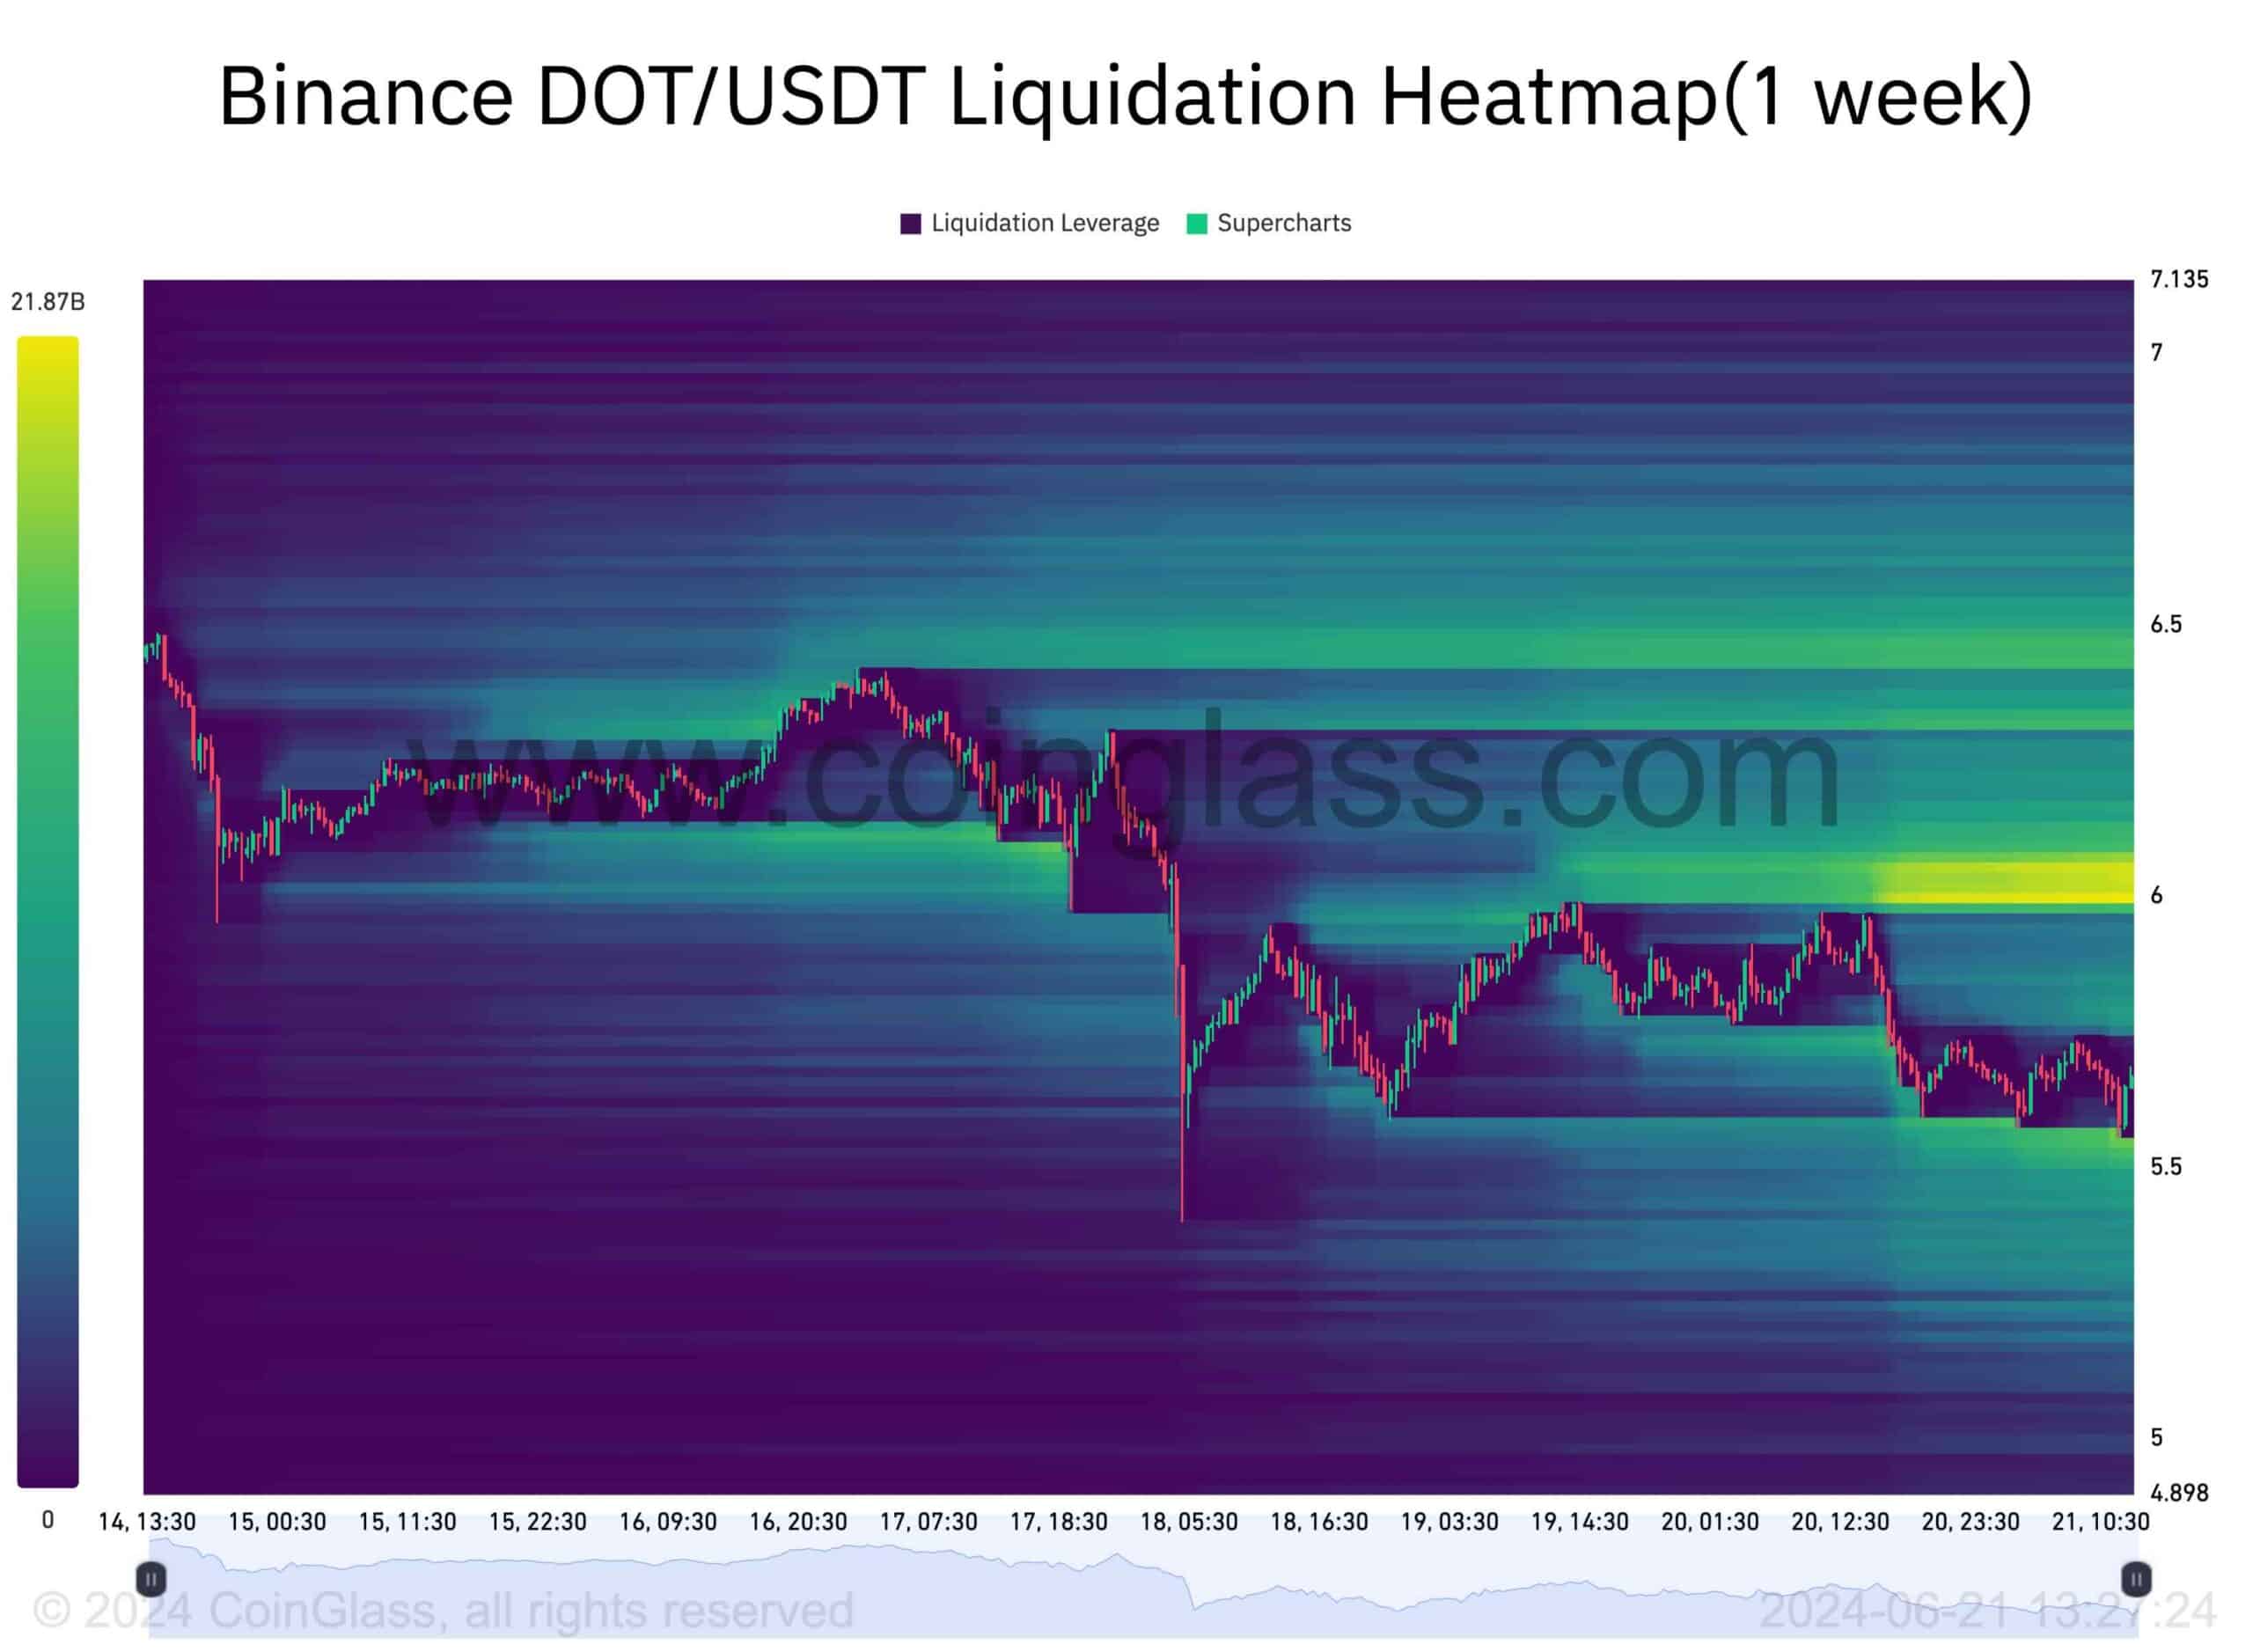
However, the price’s ability to gather liquidity at this level could also influence a sustained continuation of the bearish trend.
The post Polkadot Price Analysis: Is DOT in Danger of Falling Toward $5 Soon? appeared first on CryptoPotato.