BTC Price Slumps Below $63,000: Why Bitcoin Price is Falling Today?

The post BTC Price Slumps Below $63,000: Why Bitcoin Price is Falling Today? appeared first on Coinpedia Fintech News
Bitcoin price is plunging hard! Altcoins are bleeding! The entire crypto market cap was slashed by nearly 2%, suggesting a bearish trade is in play. Moreover, the ETF’s outflows have exceeded the inflow count and the rising altcoin dominance can be considered as a major reason behind the decline. However, the BTC price was speculated to reach $60,000 in the coming days, which appears to happen anytime this week.
At the end of the week, the BTC price was struggling hard to reclaim $65,000 but slumped below the key support level of $63,500. Moreover, the token witnessed a continued decline until the price marked a bottom of around $62,634, which can be attributed to many factors like profit-taking by investors, negative news in the market, ETFs, etc. Technically, BTC price has come within a bearish range with a limited recovery in the last week of Q2 20204.
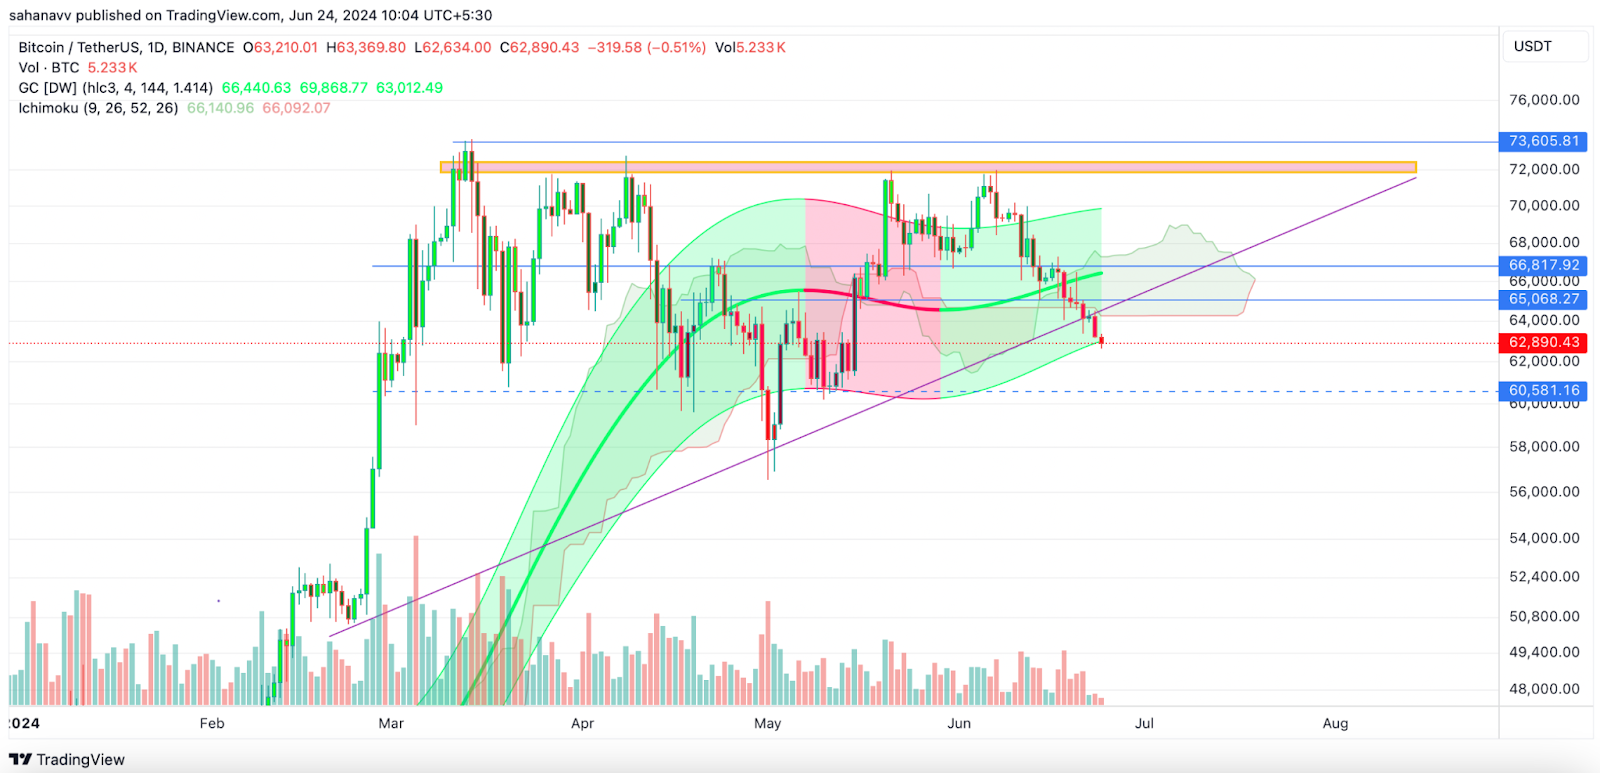
Bitcoin price broke down below the ascending trend line, which had been in strong support for over a couple of months. Unfortunately, the levels have hit the lower bands of the Gaussian Channel, which is an indication of the beginning of a bearish spell. Besides, the Ichimoku cloud is about to flash a sell signal as the levels are about to undergo a bearish crossover. The other factor which contributes towards the bearish continuation is the descending OBV.

OBV or on-balance volume, is a volume-based indicator used to gauge the next price action of the token that has dropped below the pivotal support. The dropped levels suggest that the token is in the distribution phase, flashing a warning of a downward breakout. Moreover, the volume is also decreasing, which supports the bearish narrative. Alongside, the price enters the capitulation phase yet again.
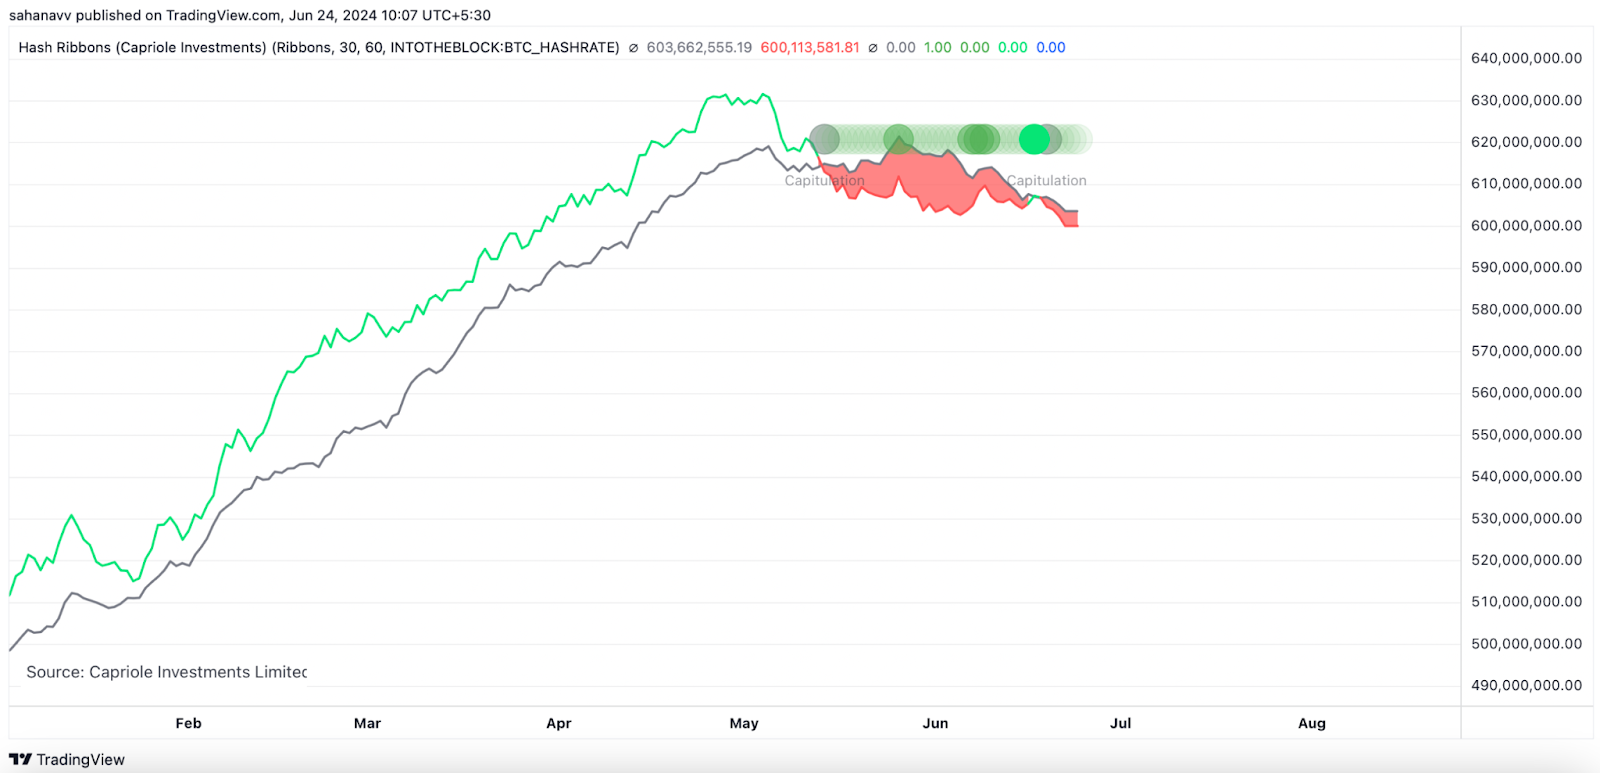
The hash ribbons indicate when the miners are in deep distress and may be capitulating. This usually occurs when the BTC price is at major lows, which may also be a good buying opportunity. The indicator considers 30-day and 60-day SMA and a downward crossover signals the beginning of the capitulation phase, as it happened a couple of days before.
Collectively, Bitcoin’s (BTC) price continues to remain in deep distress and is heading to form fresh lows below $60,000 before the end of the quarter.