Solana Slides 13% – Can It Recover Despite Analyst’s $1,000 Prediction?

Solana (SOL) has been caught in the crypto current, tossed back and forth by recent market volatility. After an impressive rally earlier in 2024, SOL has dipped by 13% over the past week, leaving investors wondering what lies ahead.
Technical analyst, Patel, believes he may have charted a course for the high-speed blockchain’s future, and it involves a refreshing beverage. Examining the weekly SOL/USDT chart, Patel identifies a classic “Cup and Handle” pattern, a bullish indicator that resembles, well, a cup and its handle.
Frothy Past, Steady Handle: A Recipe For A Breakout?
The “cup” portion of the pattern, according to Patel, stretches from mid-2021 to mid-2022, encompassing Solana’s meteoric rise and subsequent fall. The current consolidation phase forms the “handle,” a period where the price steadies after the initial parabolic movement.
For SOL bulls, the key hurdle lies in surpassing the resistance zone around $200-$225, a level that has historically acted as a psychological barrier. A successful breach of this resistance could be the first sip of a bullish resurgence.
#SOLANA $1000 Roadmap
$SOL pic.twitter.com/s7KipEbDTd
— Crypto Patel (@CryptoPatel) June 22, 2024
$520 Or $1,042: Patel’s Ambitious Price Targets
Patel’s analysis ventures beyond the immediate resistance, outlining two potential price targets for SOL in the medium to long term. The first target, TP1, sits at $520, a level that would revisit previous highs and signify a significant upswing.
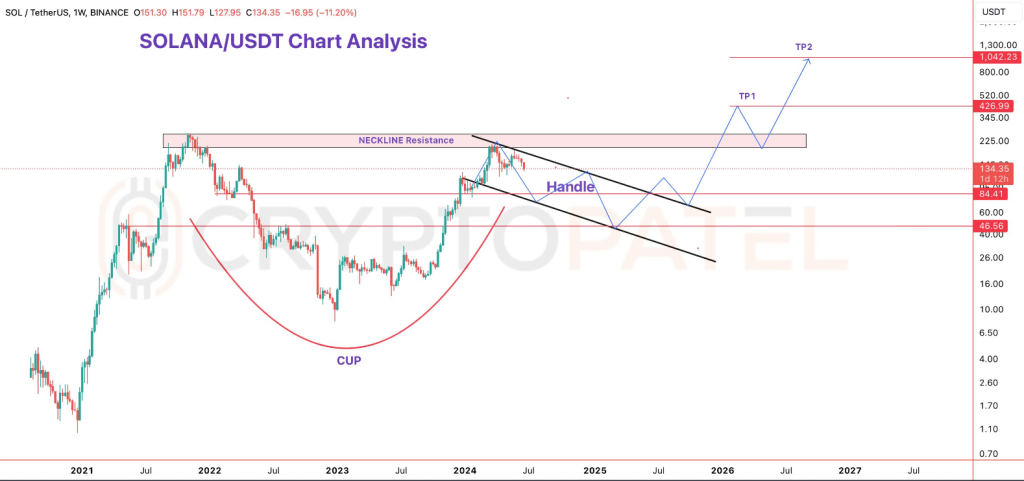
But Patel doesn’t stop there. His second target, TP2, raises eyebrows at a staggering $1,042, reflecting an extremely optimistic long-term view. However, reaching these lofty heights hinges on completing the handle formation entirely.
This could involve a further consolidation phase and a potential pullback, a necessary evil to gather momentum for a powerful breakout.
Can SOL Weather The Short-Term Squall?
While Patel’s analysis paints a rosy long-term picture, the short-term forecast for SOL is a bit cloudier. Current market indicators suggest a bearish undercurrent, with Solana trading below its 100-day Simple Moving Average (SMA). The Relative Strength Index (RSI) adds to the bearish sentiment, hovering below 50% and flirting with oversold territory.
In the immediate future, SOL could face a potential downside scenario, with some analysts predicting a dip towards the $118 support level, or even as low as $99. However, there’s always a chance of a reversal. If the tides turn, SOL could potentially surge past the $140 resistance level, setting its sights on loftier targets like $160 and $188.
Patel’s analysis serves as a strategic roadmap for investors navigating the choppy waters of the cryptocurrency market. While SOL may encounter some short-term turbulence, the long-term outlook remains bullish, contingent on breaching crucial resistance levels and maintaining upward momentum.
Featured image from Lookphotos, chart from TradingView