XRP Price Facing Another Drop: Understanding The Key Drivers
XRP price started a recovery wave from the $0.4620 support. The price is now struggling to clear $0.4780 and might restart its decline.
- XRP price is attempting a recovery wave from the $0.4620 support zone.
- The price is now trading below $0.4800 and the 100-hourly Simple Moving Average.
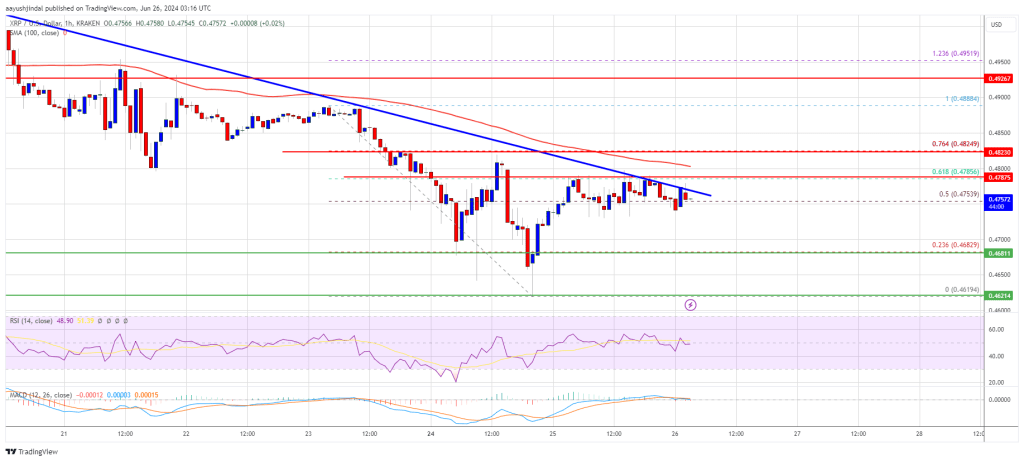
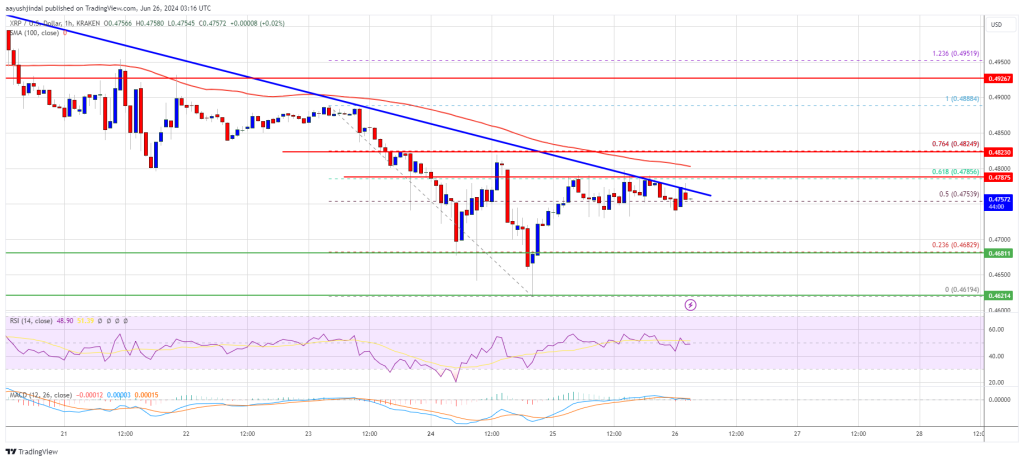
- There is a key bearish trend line forming with resistance at $0.4770 on the hourly chart of the XRP/USD pair (data source from Kraken).
- The pair might face rejections near $0.4780 and $0.480.
XRP Price Faces Resistance
XRP price extended losses below the $0.480 level like Bitcoin and Ethereum. The price even spiked below $0.4650 and tested the $0.4620 zone. A low was formed at $0.4619 and the price recently started a recovery wave.
There was an upward move above the $0.4700 and $0.4720 resistance levels. The price even surpassed the 50% Fib retracement level of the downward wave from the $0.4885 swing high to the $0.4620 low. However, the bears seem to be active near the $0.4780 zone.
They are protecting the 61.8% Fib retracement level of the downward wave from the $0.4885 swing high to the $0.4620 low. There is also a key bearish trend line forming with resistance at $0.4770 on the hourly chart of the XRP/USD pair.
It is now trading below $0.4800 and the 100-hourly Simple Moving Average. On the upside, the price is facing resistance near the $0.4770 level. The first major resistance is near the $0.4800 level.
A clear move above the $0.4800 resistance might send the price toward the $0.4885 resistance. The next major resistance is near the $0.5050 level. A close above the $0.5050 resistance zone could send the price higher. The next key resistance is near $0.5250. Any more gains might send the price toward the $0.5500 resistance.
Another Decline?
If XRP fails to clear the $0.4800 resistance zone, it could start another decline. Initial support on the downside is near the $0.4685 level.
The next major support is at $0.4620. If there is a downside break and a close below the $0.4620 level, the price might gain bearish momentum. In the stated case, the price could even trade below the $0.450 support in the near term.
Technical Indicators
Hourly MACD – The MACD for XRP/USD is now losing pace in the bullish zone.
Hourly RSI (Relative Strength Index) – The RSI for XRP/USD is now near the 50 level.
Major Support Levels – $0.4685 and $0.4620.
Major Resistance Levels – $0.4770 and $0.4800.