Bullish Signs For Polkadot (DOT): Analyst Eyes $12 On The Horizon
Polkadot (DOT), often heralded as the “internet of blockchains,” has recently seen its price drop below the crucial $6 mark. This decline has caused ripples across the investor community, raising concerns about whether this is a temporary setback or the beginning of a longer downward trend. As analysts pore over charts and technical indicators, the debate rages on about the future trajectory of DOT.
Bullish Signals Amidst Short-Term Woes
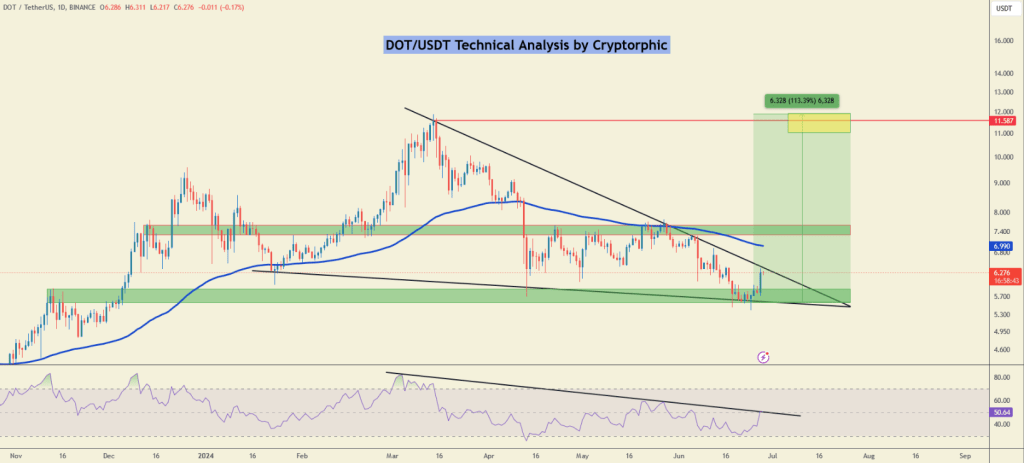
For those who place their faith in technical analysis, there is still a glimmer of hope amid Polkadot’s recent struggles. A descending triangle pattern has emerged on the DOT/USDT chart, historically pointing to a support zone between $5.5 and $6. This area has previously acted as a floor, staving off more severe price declines.
#DOTUSDT is currently trading within a well-defined descending triangle pattern with strong support around the $5.5-$6 range.
~ Support Zone: A strong support zone exists between $5.5 and $6, highlighted in green. This area has historically acted as a significant support level,… pic.twitter.com/jUSXMqJ9FW
— Cryptorphic (@Cryptorphic1) June 28, 2024
For a substantial price surge, Polkadot needs to break above the key resistance levels of $7.5 and $11.55, the latter being the peak price earlier this year. If bulls can muscle through these resistance levels, it could trigger a targeted ascension towards the $12 mark. On the flip side, if the price dips below the critical support of $5.5, it could invalidate the current bullish outlook and signal a more prolonged period of decline.

Long-Term Vision For Polkadot
Despite the recent price fluctuations, Polkadot’s long-term value proposition remains a beacon of hope for many investors. Polkadot aims to address one of the most significant challenges in the blockchain space—interoperability.
Interestingly, the Relative Strength Index (RSI) is showing bullish divergence—a scenario where the RSI forms higher lows even as the price continues to fall. This divergence suggests that buying pressure might be building, potentially setting the stage for a price reversal.
According to recent price predictions, Polkadot’s value could see a significant rise of 226%, potentially reaching $19.67 by July 30, 2024. This forecast aligns with a neutral market sentiment and a Fear & Greed Index score of 47, indicating a balanced outlook. Over the past 30 days, Polkadot has recorded 47% green days with an 8.07% price volatility.
Yet, investors should look beyond the immediate price movements and consider broader market dynamics. Regulatory scrutiny, competition from other interoperability solutions, and global economic conditions are all factors that can influence Polkadot’s price. Moreover, assessing the progress of Polkadot’s development roadmap and its core functionalities can provide deeper insights into the project’s health and future potential.
The crypto market’s inherent volatility demands careful consideration and a strategic approach to investing in assets like Polkadot. As the market evolves, Polkadot’s journey will undoubtedly be one to watch, reflecting broader trends and shifts within the blockchain industry.
Featured image from Deseret News, chart from TradingView