Bullish Patterns Predict 30% Jump for Bitcoin As Ether Preps For $5,000


The post Bullish Patterns Predict 30% Jump for Bitcoin As Ether Preps For $5,000 appeared first on Coinpedia Fintech News
Following a massive recovery over the weekends, the BTC price enters the new week optimistically. With an almost 3% rise, Bitcoin marks the end of the correction phase in the short term, resulting in a broader market recovery.
As July starts, the overnight turn of sentiments teases a bull run with a breakout. Further, the underlying gears of bullishness churning and price analysis reveal a 30% or more jump this month.
Will the second half of 2024 kickstart the highly anticipated bull market and the altcoin season post-halving? For the long-term HODLers and institutions, the Bitcoin price prediction of hitting the 6-digit figure of $100,000 in 2024, the sideways in Q2 2024, must end soon.
Let’s examine the BTC price action in detail for an analytic approach to the crypto market.
Bitcoin Price Performance
With a volatile month, Bitcoin ends June on a bearish note of 7.12% with a visible lower price rejection. The lower price rejection marks the third successful attempt by buyers to bounce back the BTC price from the crucial $60,000 demand zone.
Currently trading at $63,189, Bitcoin trades at a 0.83% intraday gain during the early hours of Asian markets. The remarkable surge of 80% in trading volume within 24 hours bolsters the recent BTC price reversal.
Bitcoin is up by 4.75% within 72 hours, with the third positive candle in the making. The price jump marks the end of correction for the biggest crypto. Further, with the triple white soldier candlestick formation, the uptrend chances are high for Bitcoin.
Bullish Patterns On The Rise
The triple white soldier, after the accumulation phase at the $60,000 zone, hints at a potential bounce back. Furthermore, the sideways trend in the daily chart over the past four months reveals a bullish pattern and bull run awaiting a breakout.
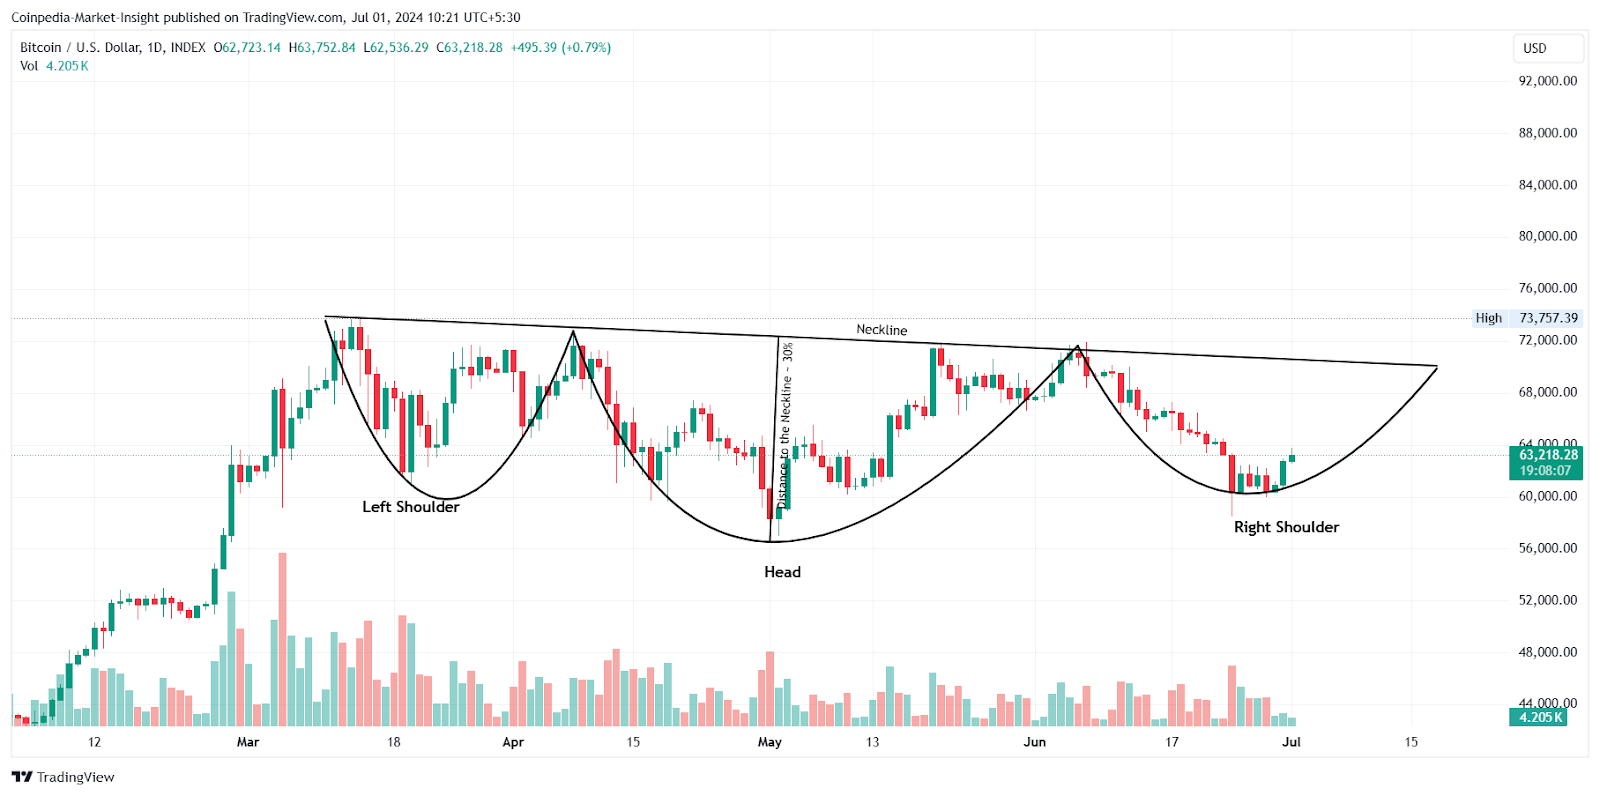
The lower price rejection trend reveals a strong resistance trendline, acting as the neckline of an inverted head and shoulder pattern. Furthermore, considering the bull run in early 2024, the BTC price action reveals another pattern that bolsters the uptrend possibility.
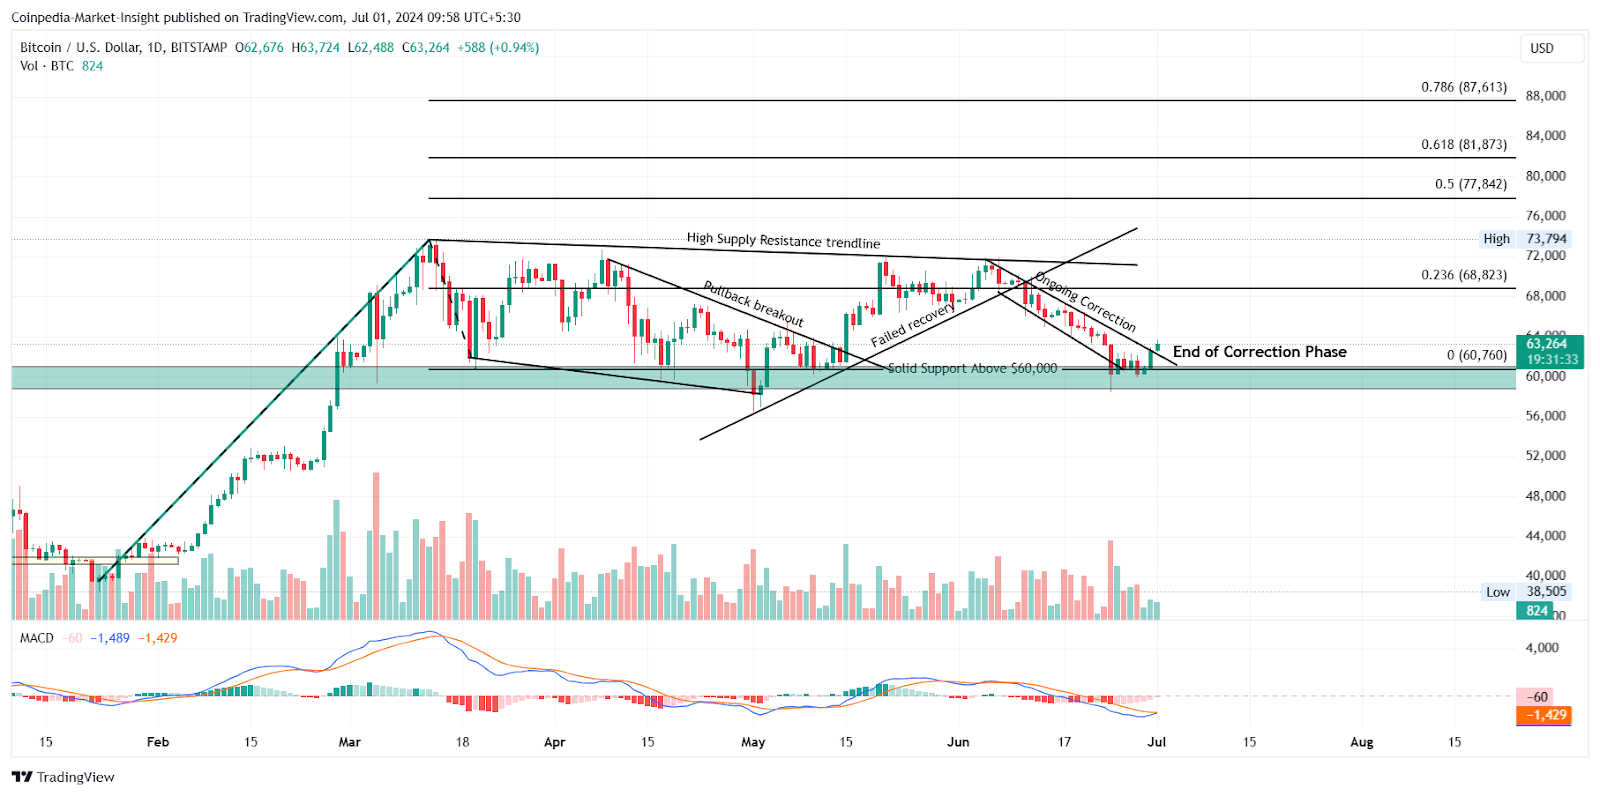
Combining the 85% uptrend to hit $73K with the lateral shift of the trend, a bullish flag pattern is revealed. With the third reversal within the band, the BTC price marks a channel breakout. This increases the chances of a bull cycle to the overhead trendline. Further, the MACD indicator reveals a bullish crossover supporting the upcycle.
Analysts Support Bull Run in July
As per the monthly Bitcoin returns data available on Coinglass, analyst Ali Martinez finds an interesting regularity. Over a span of 11 years, Bitcoin prices tend to have a positive July if June registers a drop. This has happened in the years 2013, 2018, 2020, 2021, and 2022, with the most notable jumps of 24% in 2020 and 20% in 2018.
Will Bitcoin Jump Above $73,000 This Month?
With multiple bullish patterns at play, the Bitcoin reversal rally is expected to gain momentum this week. Further, the chances of retail demand increasing with the reversal near $60,000 are high, fueling the next stage of the uptrend.
The flag pattern reveals a potential jump to the overhead trendline near the $70,000 mark. Meanwhile, the inverted head and shoulder pattern signals a potential breakout rally.
According to trend-based Fibonacci levels and the breakout anticipations, the bull run in Bitcoin can target $81,873 or the 61.80% level this month. On a weekly front, the uptrend could scale to the $68,823 mark or the 23.60% Fibonacci level.
Ethereum Prepares For A Bull Run
With Bitcoin on the path to price recovery, Ethereum took off from the $3,300 level with a morning star pattern. The Ether price was up by almost 4% within 48 hours and formed two bullish engulfing candles.
The bull run marks an early reversal before reaching the long-term support trendline. Trading at $3,481, Ethereum registers an intraday gain of 1.46%.
Further, the ETH price action in the monthly chart marks a morning star pattern at the 61.80% Fibonacci level. This increases the bull cycle chances and could shortly challenge the 78.60% level at $3,859. Further, the early reversal undermines the looming double-top threat and teases a bullish cup and handle pattern.
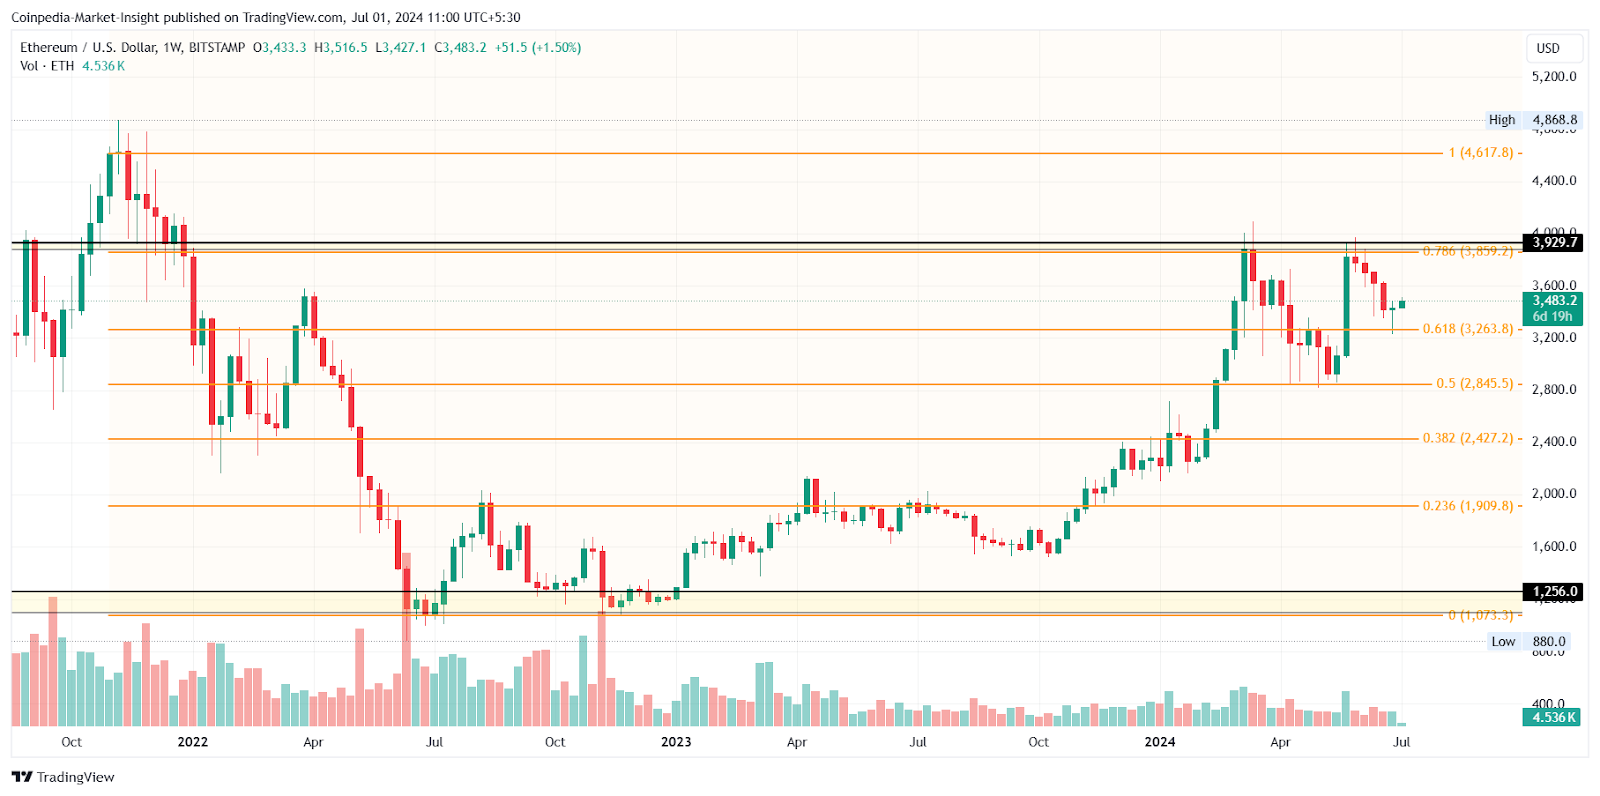
Considering the uptrend continues with the broader market recovery, the ETH price trend can hit a new 52W high. As per the Fibonacci levels, the uptrend can reach the $4,617 mark this month. Optimistically, the bull run can top the $5,000 psychological milestone.