Bitcoin July Outlook: PlanB Finds No Abnormalities; 90% Holders In Profit

The post Bitcoin July Outlook: PlanB Finds No Abnormalities; 90% Holders In Profit appeared first on Coinpedia Fintech News
PlanB, the creator of the widely used Stock-2-Flow (S2F) model has determined the market outlook for July, based on seven important charts. It is worth mentioning that PlanB is the same person who predicted Bitcoin might hit $100,000 this year.
First chart: The Stock-to-Flow Model
PlanB said that Bitcoin closed June slightly above $62,000. The market has been in a boring trading range between $60,000 and $70,000 for a couple of months now. Until we find direction, it will likely stay there. Historically, after halving, Bitcoin’s price lags the model’s value and starts moving only a few months later. It typically takes 12 to 18 months for the price to reach the stock-to-flow model predictions.
Next chart: The Red Market Indicator
PlanB asserted that we are still in a bull market. Although it might not feel that way, the numbers don’t lie. These are on-chain numbers, showing no abnormalities. I would be worried if we saw yellow or green (which is impossible now), but we don’t have that; it’s red, indicating a bull market. This gives me some comfort.
Bitcoin Realized Price
At the end of June, the realized price was $31,000. The two-year realized price is $48,000, and the five-month realized price is currently $65,000. Bitcoin is slightly below the five-month realized price, which has historically served as a support line in bull markets. He expects Bitcoin to bounce from this five-month realized price.
Moving Average 200 Chart
The 200-week moving average, which represents the average Bitcoin price over the last four years, is around $37,000 and steadily rising. This moving average has never gone down, only gradually rising, indicating nothing abnormal.
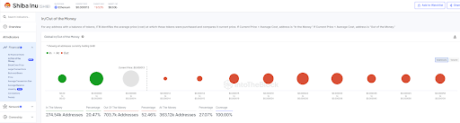
Bitcoin in Profit
Currently, 90% of holders are in profit, similar to the start of the 2013 bull market, which also saw a lot of yellow, orange, and red indicators. The market is clearly searching for direction, and we need to remain patient until it finds it.