Bitcoin Price Analysis: BTC Bulls Back in Town but Will $60K Fall?
Bitcoin has recently seen an uptick in demand near a crucial support level, leading to a slight rebound above the 200-day moving average at $59.2K.
This price action highlights the potential for a bullish reversal if the price stabilizes above the 200-day moving average.
Technical Analysis
By Shayan
The Daily Chart
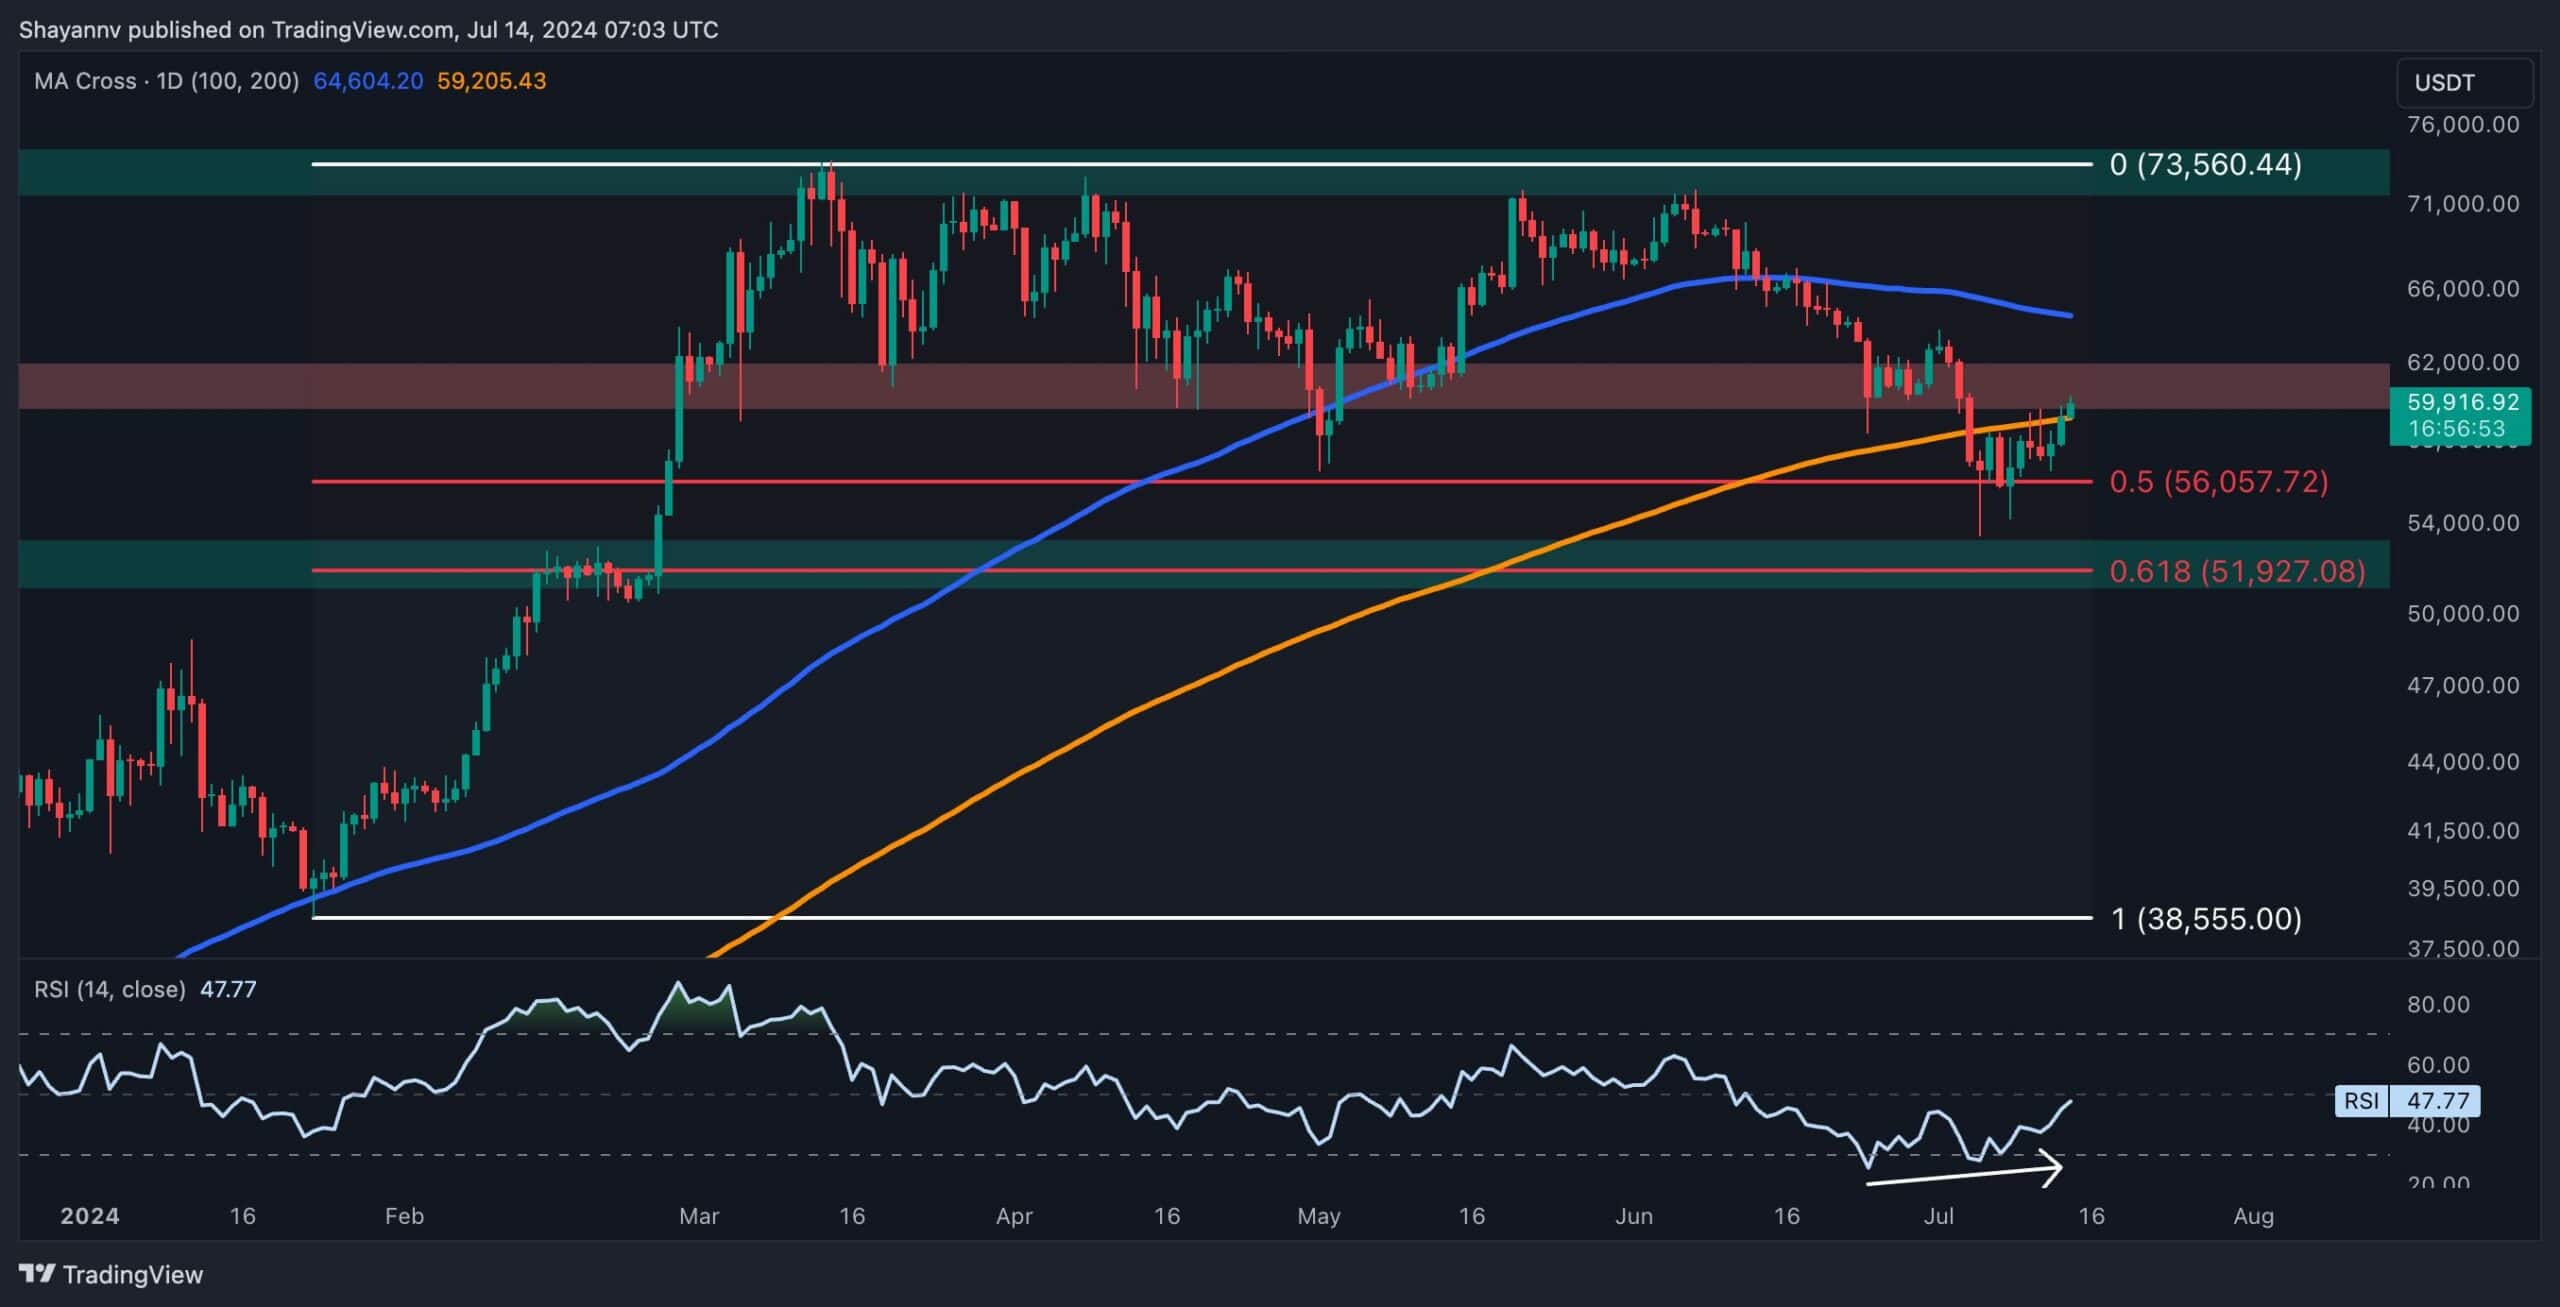
A detailed analysis of Bitcoin’s daily chart reveals that after a prolonged bearish trend, Bitcoin broke below the 200-day moving average at $59.2K, introducing significant fear and uncertainty into the market.
This MA is a vital support level for Bitcoin, and its breach typically signals a potential bearish trend. However, Bitcoin found strong demand at the substantial support region of the 0.5 Fibonacci level ($56K), resulting in a slight bullish rebound. The price has now climbed back above the 200-day MA, indicating a potential bear trap.
Additionally, a bullish divergence between the price and the RSI indicator further suggests the possibility of a bullish reversal in the short term. If Bitcoin stabilizes above the 200-day MA, this could confirm a bullish revival in the mid-term, with the next target being the 100-day moving average at $64.6K.

The 4-Hour Chart
On the 4-hour chart, Bitcoin faced rejection near the multi-month upper boundary at $71K, entering a sustained bearish trend marked by lower lows and highs.
Upon reaching the decisive support region at $56K, the bearish momentum faded, resulting in a sideways consolidation. Following this consolidation, an increase in buying activity led to a slight bullish rebound.
Bitcoin is now at a crucial resistance region, encompassing the significant $60K psychological resistance mark and the multi-week downtrend line, where selling pressure may increase.
If the cryptocurrency reclaims this resistance area, the bullish trend could continue toward the $65K mark. Conversely, a rejection at this level would likely result in the continuation of the bearish trend, targeting the critical $56K support.

On-chain Analysis
By Shayan
On-chain data highlighting miners’ profitability has proven to be a valuable tool for anticipating market bottoms during bear markets and the end of correction periods within bull markets. Analyzing this data can provide insights into potential market trends, particularly in relation to Bitcoin’s price movements.
Historically, significant drops in miners’ profitability during bull cycles have often been precursors to substantial price increases for Bitcoin. Notable instances of this occurred in:
- 2016: During this bull cycle, miners’ profitability decreased sharply, as highlighted by the red-circled area. Following this decline, Bitcoin experienced a strong upward trend.
- 2020: A similar pattern was observed, where a rapid decline in miners’ profitability was followed by the beginning of a robust bull market for Bitcoin.
As of 2024, a comparable pattern in miners’ profitability has been detected. The indicator has fallen significantly, mirroring the movements observed in the 2016 and 2020 bull cycles. This suggests that although the exact end of the current correction period is uncertain, the transition to a bull market may not be far off.

The post Bitcoin Price Analysis: BTC Bulls Back in Town but Will $60K Fall? appeared first on CryptoPotato.