Ethereum Price Analysis: ETH Eyes $3.5K as ETF Launch Anticipation Grows
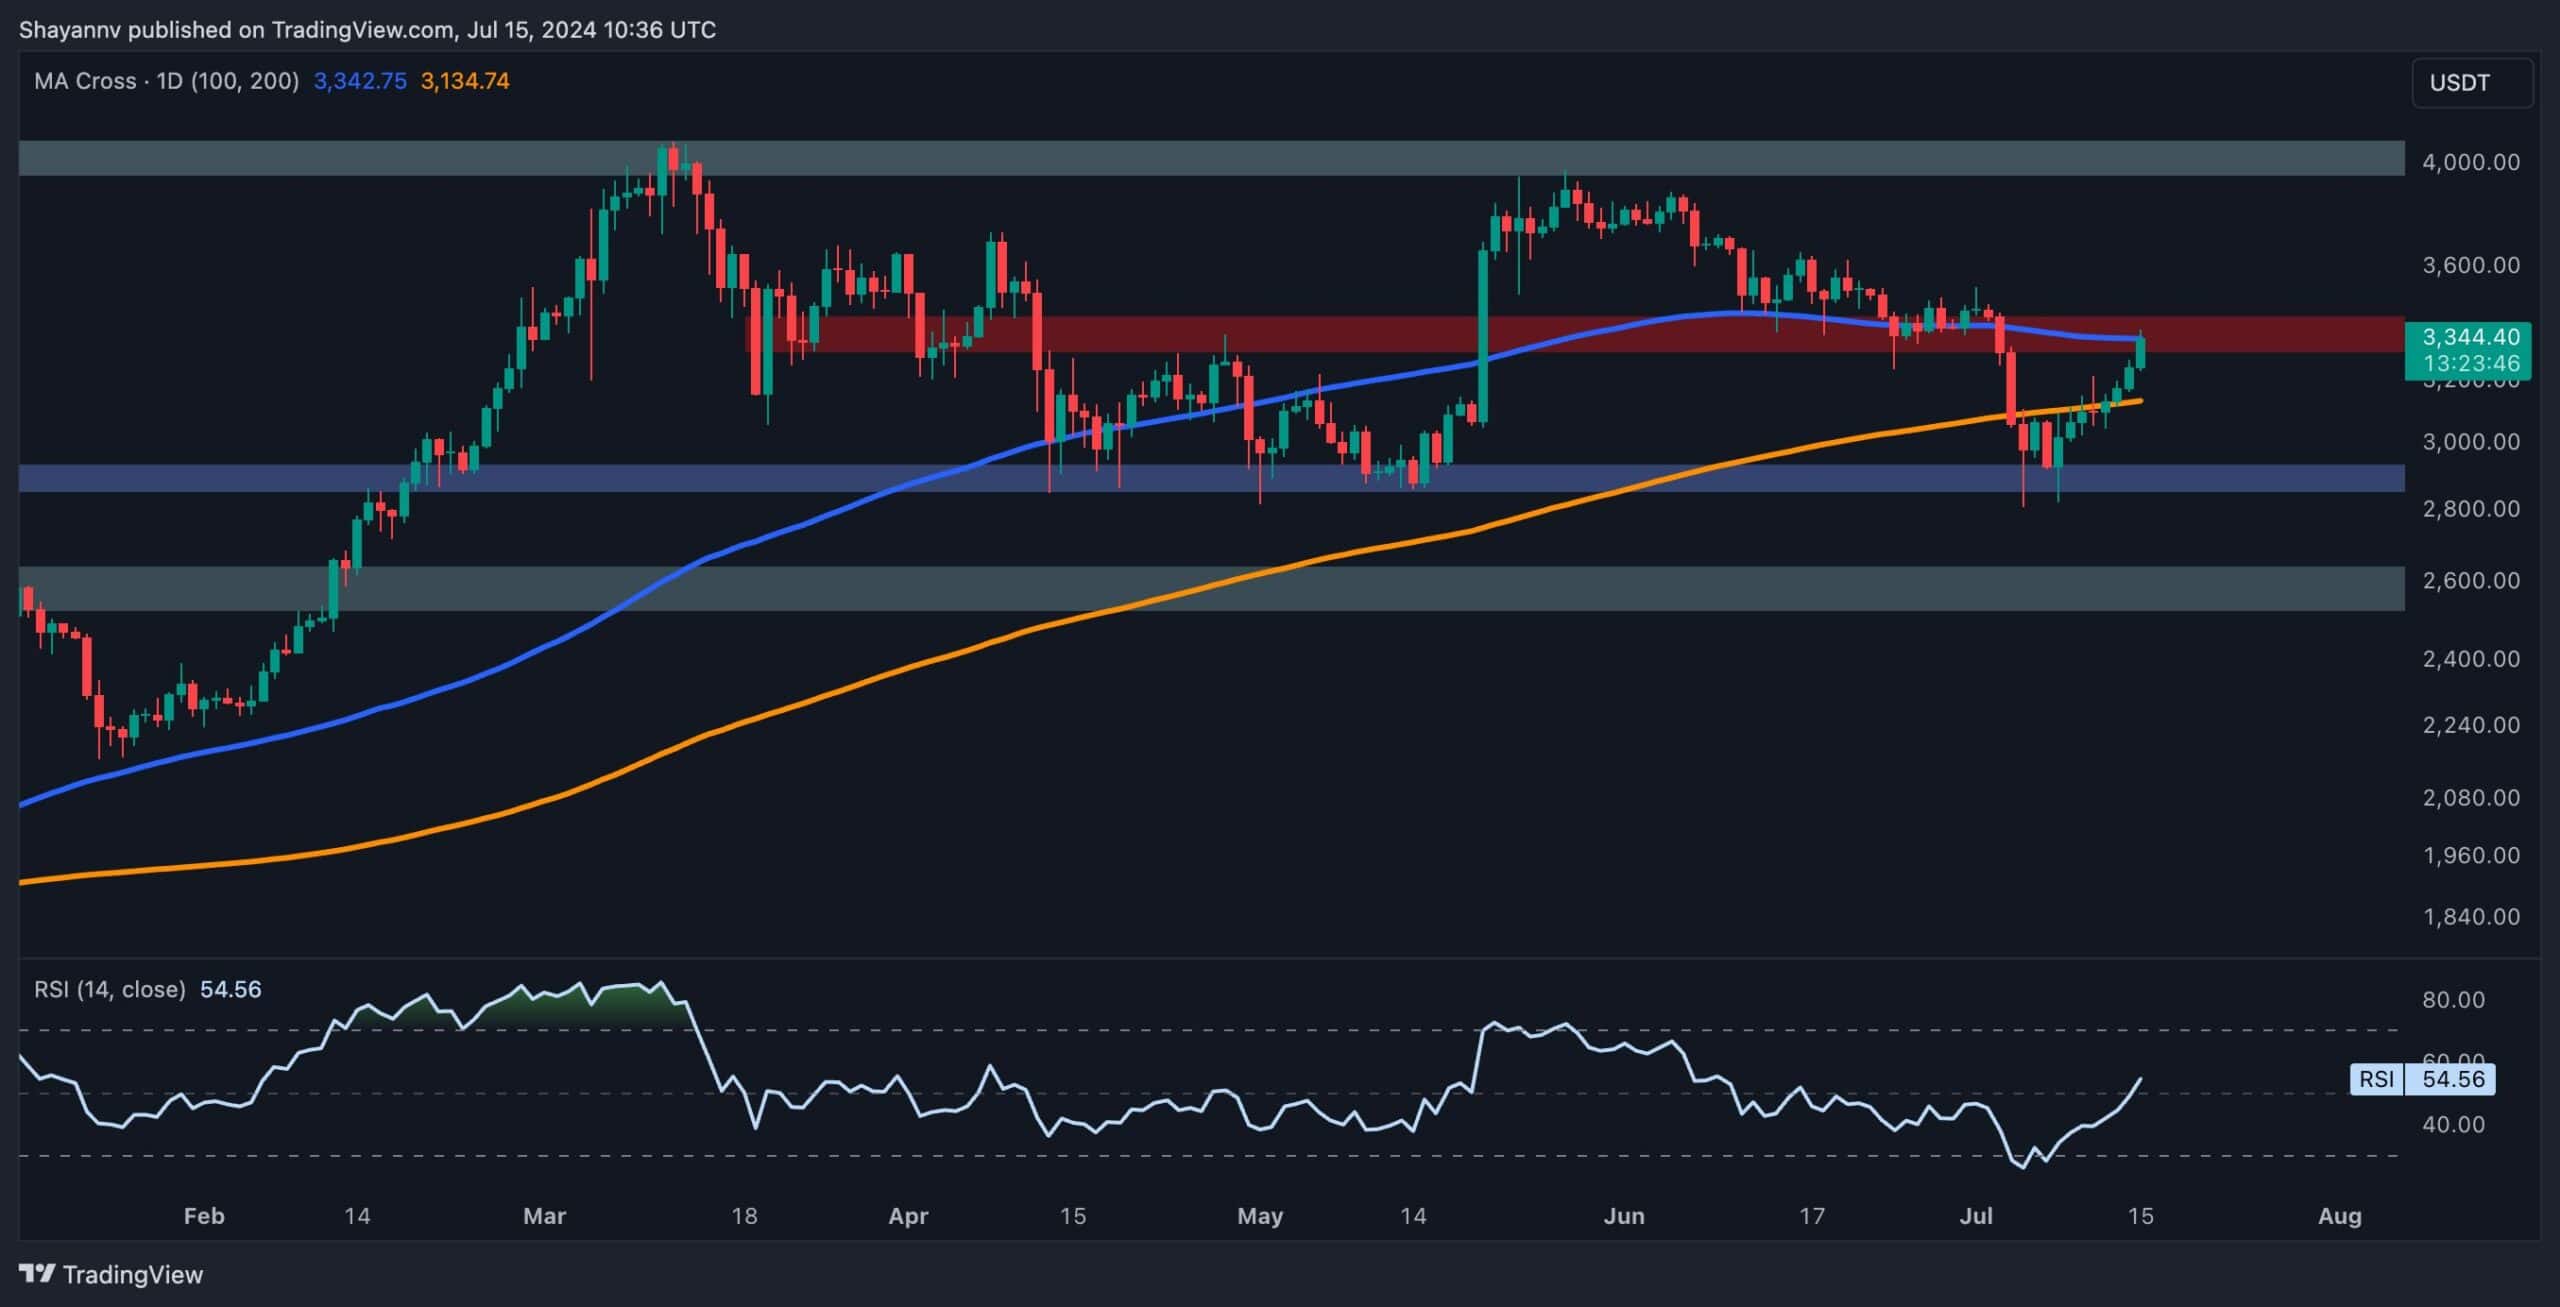
Ethereum has recently seen an uptick in demand near a crucial support level, leading to a notable rebound above the 200-day moving average at $3,134 and reaching the 100-day MA.
This price action highlights the potential for a bullish reversal if the price recovers above the 100-day MA of $3,342.
Technical Analysis
By Shayan
The Daily Chart
A detailed analysis of Ethereum’s daily chart reveals that after a prolonged bearish trend, the cryptocurrency briefly broke below the 200-day moving average at $3,081, introducing significant fear and uncertainty into the market, as this MA is a vital support level for the price.
However, Ethereum found strong support at the substantial and decisive support region of $3K, resulting in a notable bullish rebound. The price has now climbed above the 200-day MA and continued surging toward the 100-day MA, indicating a potential bear trap and false breakout.
Currently, ETH has reached the 100-day MA of $3,142 and is on the verge of reclaiming it. This MA also aligns with the tactical resistance region of $3.3K, making it a robust barrier to buyers. Yet, if it stabilizes above the 100-day MA, this could confirm a bullish revival in the mid-term, with the next target being the $4K yearly high.

The 4-Hour Chart
On the 4-hour chart, Ethereum faced rejection near the multi-month descending trendline at $3.5K, entering a sustained and impulsive bearish trend. Upon reaching the decisive and psychological support region at $2.8K, the bearish momentum faded, resulting in the formation of a notable double-bottom pattern.
Following this consolidation, an increase in buying activity led to a bullish rebound, breaking above the neckline and subsequently forming a successful pullback to the broken level.
Thereafter, the price experienced an impulsive surge, which clearly hinted at a bullish revival in market sentiment. Ethereum is now at a crucial resistance region, encompassing the significant $3.4K psychological mark and the multi-month downtrend line, where selling pressure may increase.
If Ethereum reclaims this resistance area, the bullish trend could continue toward the $3.7K mark. Conversely, a rejection at this level would likely result in the continuation of the bearish trend, targeting the critical $2.8K support.

Sentiment Analysis
By Shayan
Ethereum has recently experienced a bullish rebound, surging significantly toward the critical $3.5K resistance zone. Understanding the potential targets for the bullish trend is essential for predicting future price movements.
The accompanying chart identifies potential liquidation zones within Ethereum’s price action, offering insights for mid-term strategies by informed traders. Following the recent bearish decline below the $3K threshold, the price has tapped into the liquidity pool below $3K, primarily comprising sell-side liquidity from long positions opened near this mark.
Looking ahead, significant liquidity is observed around the $4K resistance region, primarily consisting of buy-stop orders triggered by aggressive short positions during the previous impulsive bearish trend. In the mid-term, a plausible scenario involves the continuation of the bullish trend to capture liquidity near and above the $4K resistance level. This approach aims to exploit these liquidity zones strategically, potentially supporting further upward momentum in Ethereum’s price.

The post Ethereum Price Analysis: ETH Eyes $3.5K as ETF Launch Anticipation Grows appeared first on CryptoPotato.