Breakout Confirmed: Shiba Inu Targets 45% Price Explosion, Says Crypto Analyst

The anonymous crypto analyst pullbacksignal has published a technical analysis of Shiba Inu (SHIB) via TradingView, which attests to the cryptocurrency a strong upside potential. In the 4-hour chart against Tether (USDT), the Shiba Inu price has formed an inverse head and shoulders pattern, traditionally recognized as a bullish reversal signal following a downtrend.
Shiba Inu Price Eyes 45% Rally
The inverse head and shoulders pattern is marked by three troughs with the middle trough (head) deeper than the flanking ones (shoulders), and it is the opposite of the traditional head and shoulders bearish pattern. The shoulders are ideally of equal depth, and the head is a clear dip below the shoulders.
A key feature of this pattern is the ‘neckline,’ a resistance line drawn by connecting the high points of the two troughs forming the shoulders. A decisive breakout above this neckline is generally perceived as a confirmation of the pattern and signals the start of a potential bullish trend.
In his chart, the crypto analyst highlights this breakout signal. The neckline, drawn in red, has been breached on Saturday, July 13, with a closing price above this line, signaling bullish momentum.
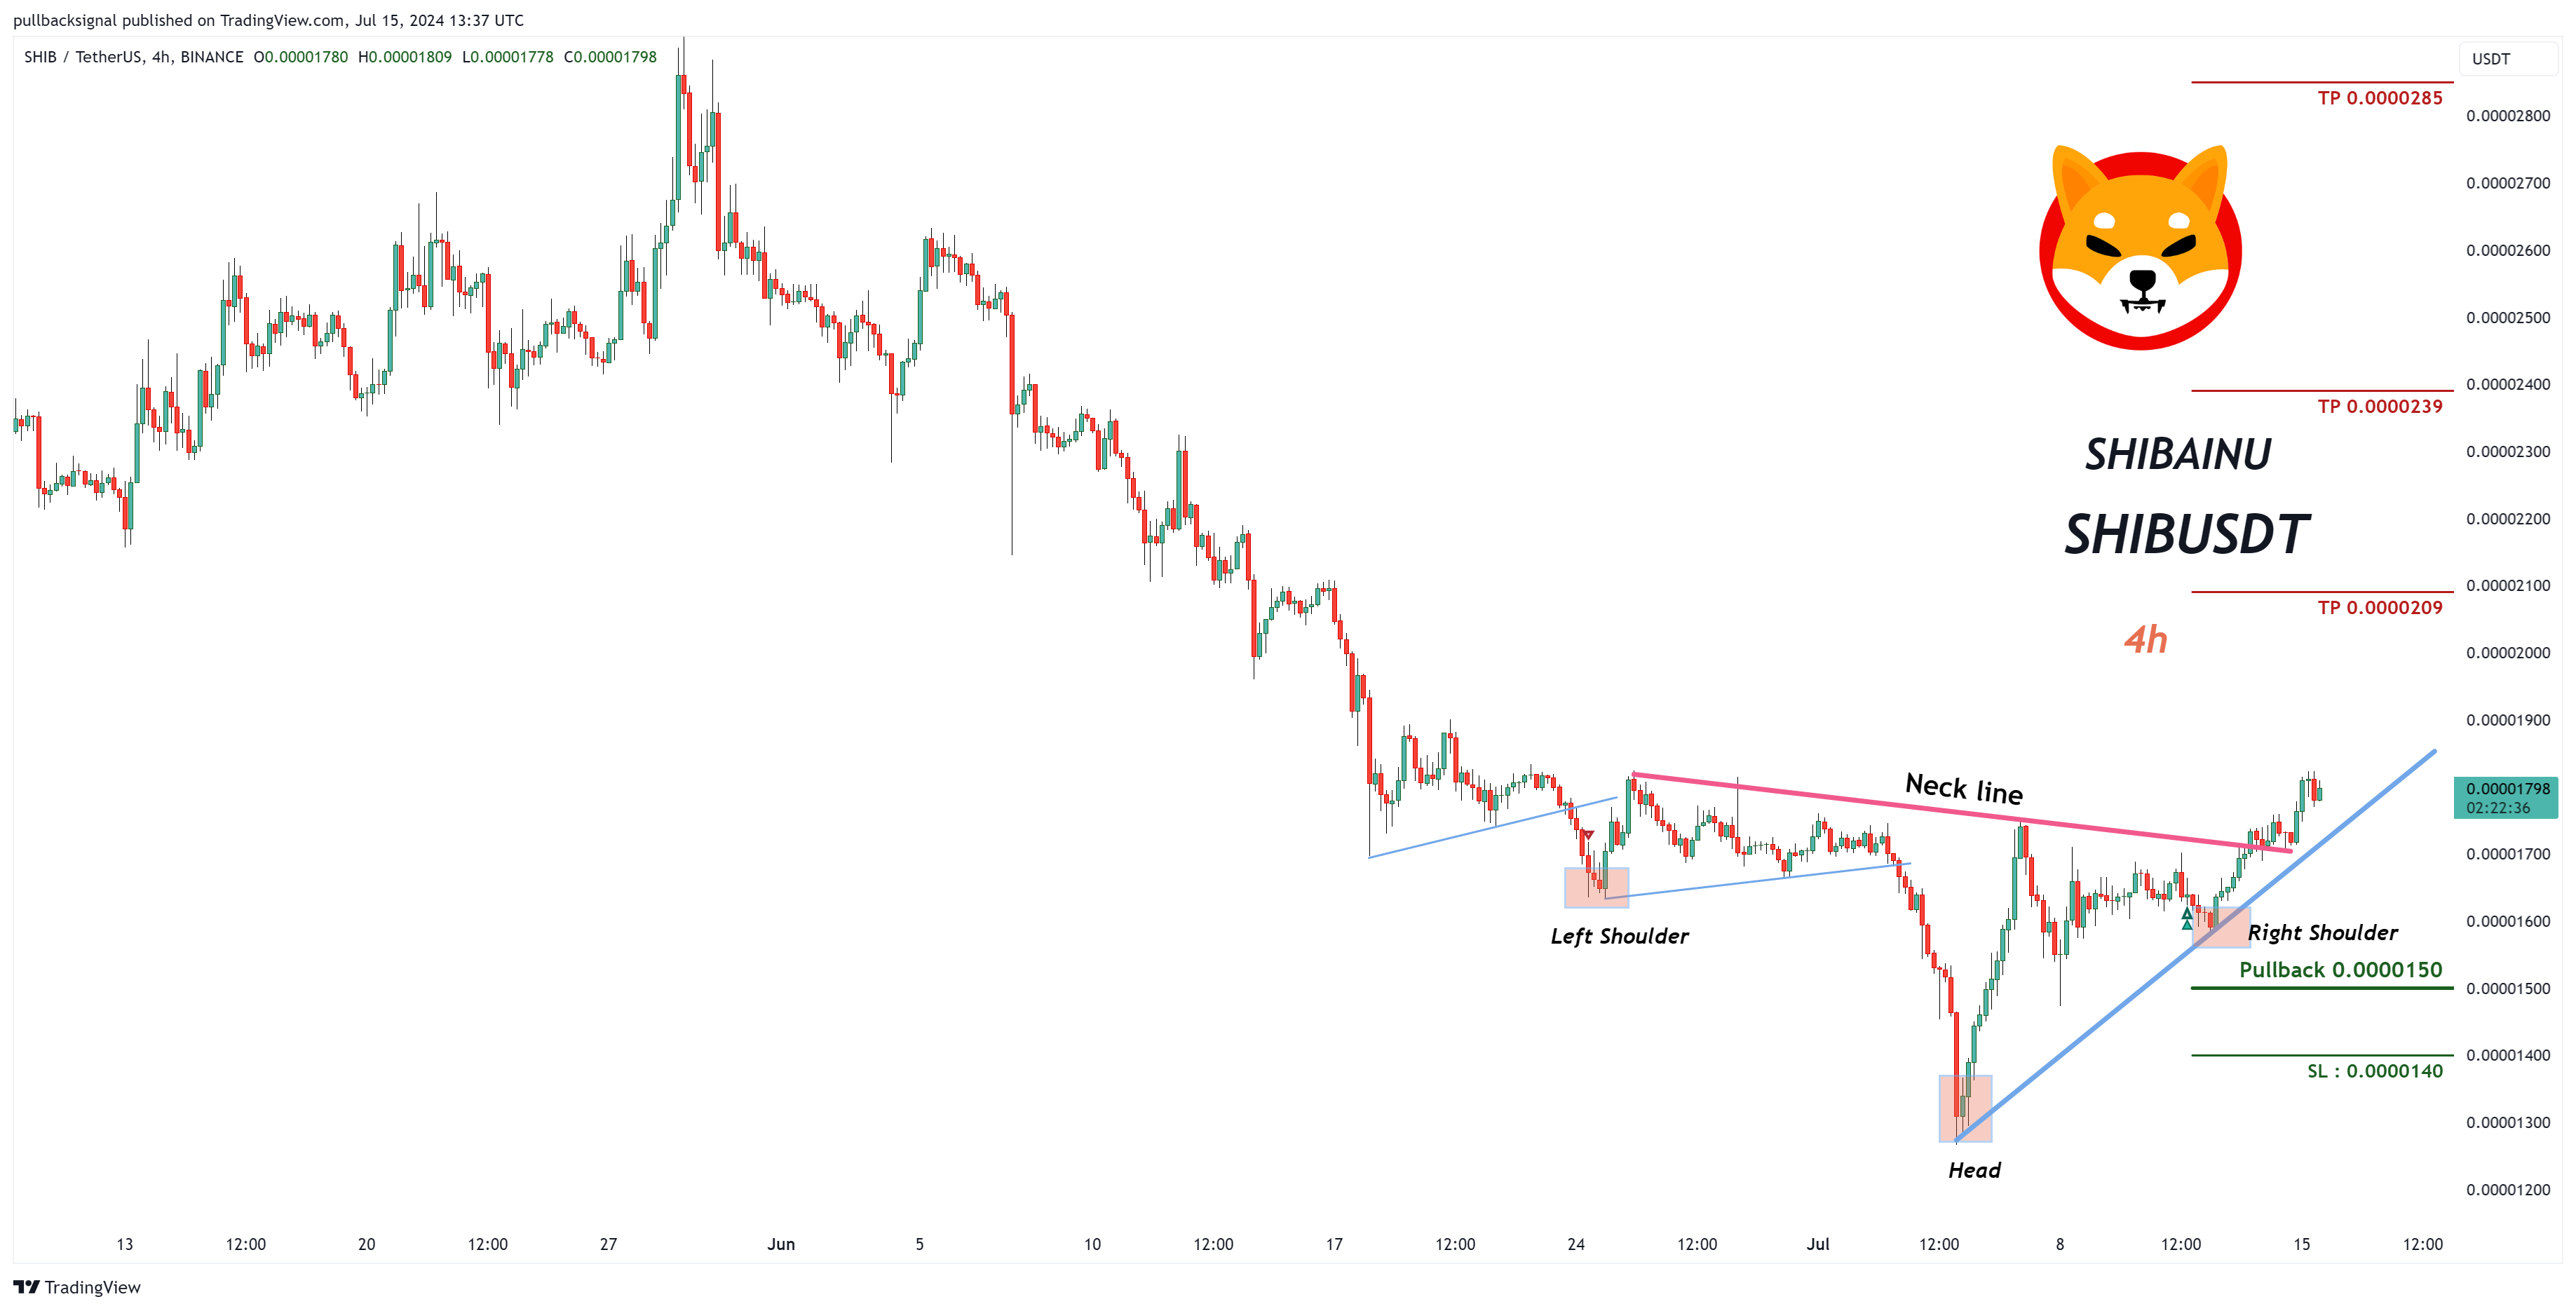
The left shoulder and right shoulder are aligned at approximately $0.000016, framing the head which dips below $0.000013. This dip, followed by a rebound to the second shoulder, completes the formation and sets the stage for potential upward movement.
Notably, the crypto analyst identifies three potential targets post-breakout which investors might aim for. The first target is at $0.0000209, representing an initial resistance level past the breakout point. The second target lies at $0.0000239 and could serve as a mid-term goal for the price following the breach.
The ultimate target at $0.0000285 reflects the full potential of the breakout, equating to an approximate 45% increase from the neckline breakout level.
Moreover, an important element in the chart is the ascending blue trendline. This line, starting from the base of the head and moving upward through the formation of the right shoulder, underpins the bullish sentiment, illustrated by a rising support level.
This trendline not only confirms the higher lows, which align with the bullish reversal pattern, but also serves as a dynamic support that can guide trading decisions. A bounce off this trendline could offer additional buying opportunities, reinforcing confidence in the continuation of the uptrend.
For traders looking to capitalize on this setup, it is essential to manage risk. The analysis suggests a stop loss at $0.0000140. Furthermore, the pullback level marked at $0.0000150 is highlighted as a crucial support area. If the entire market is about to see another major correction, this price could serve as the ultimate “buy-the-dip” level.
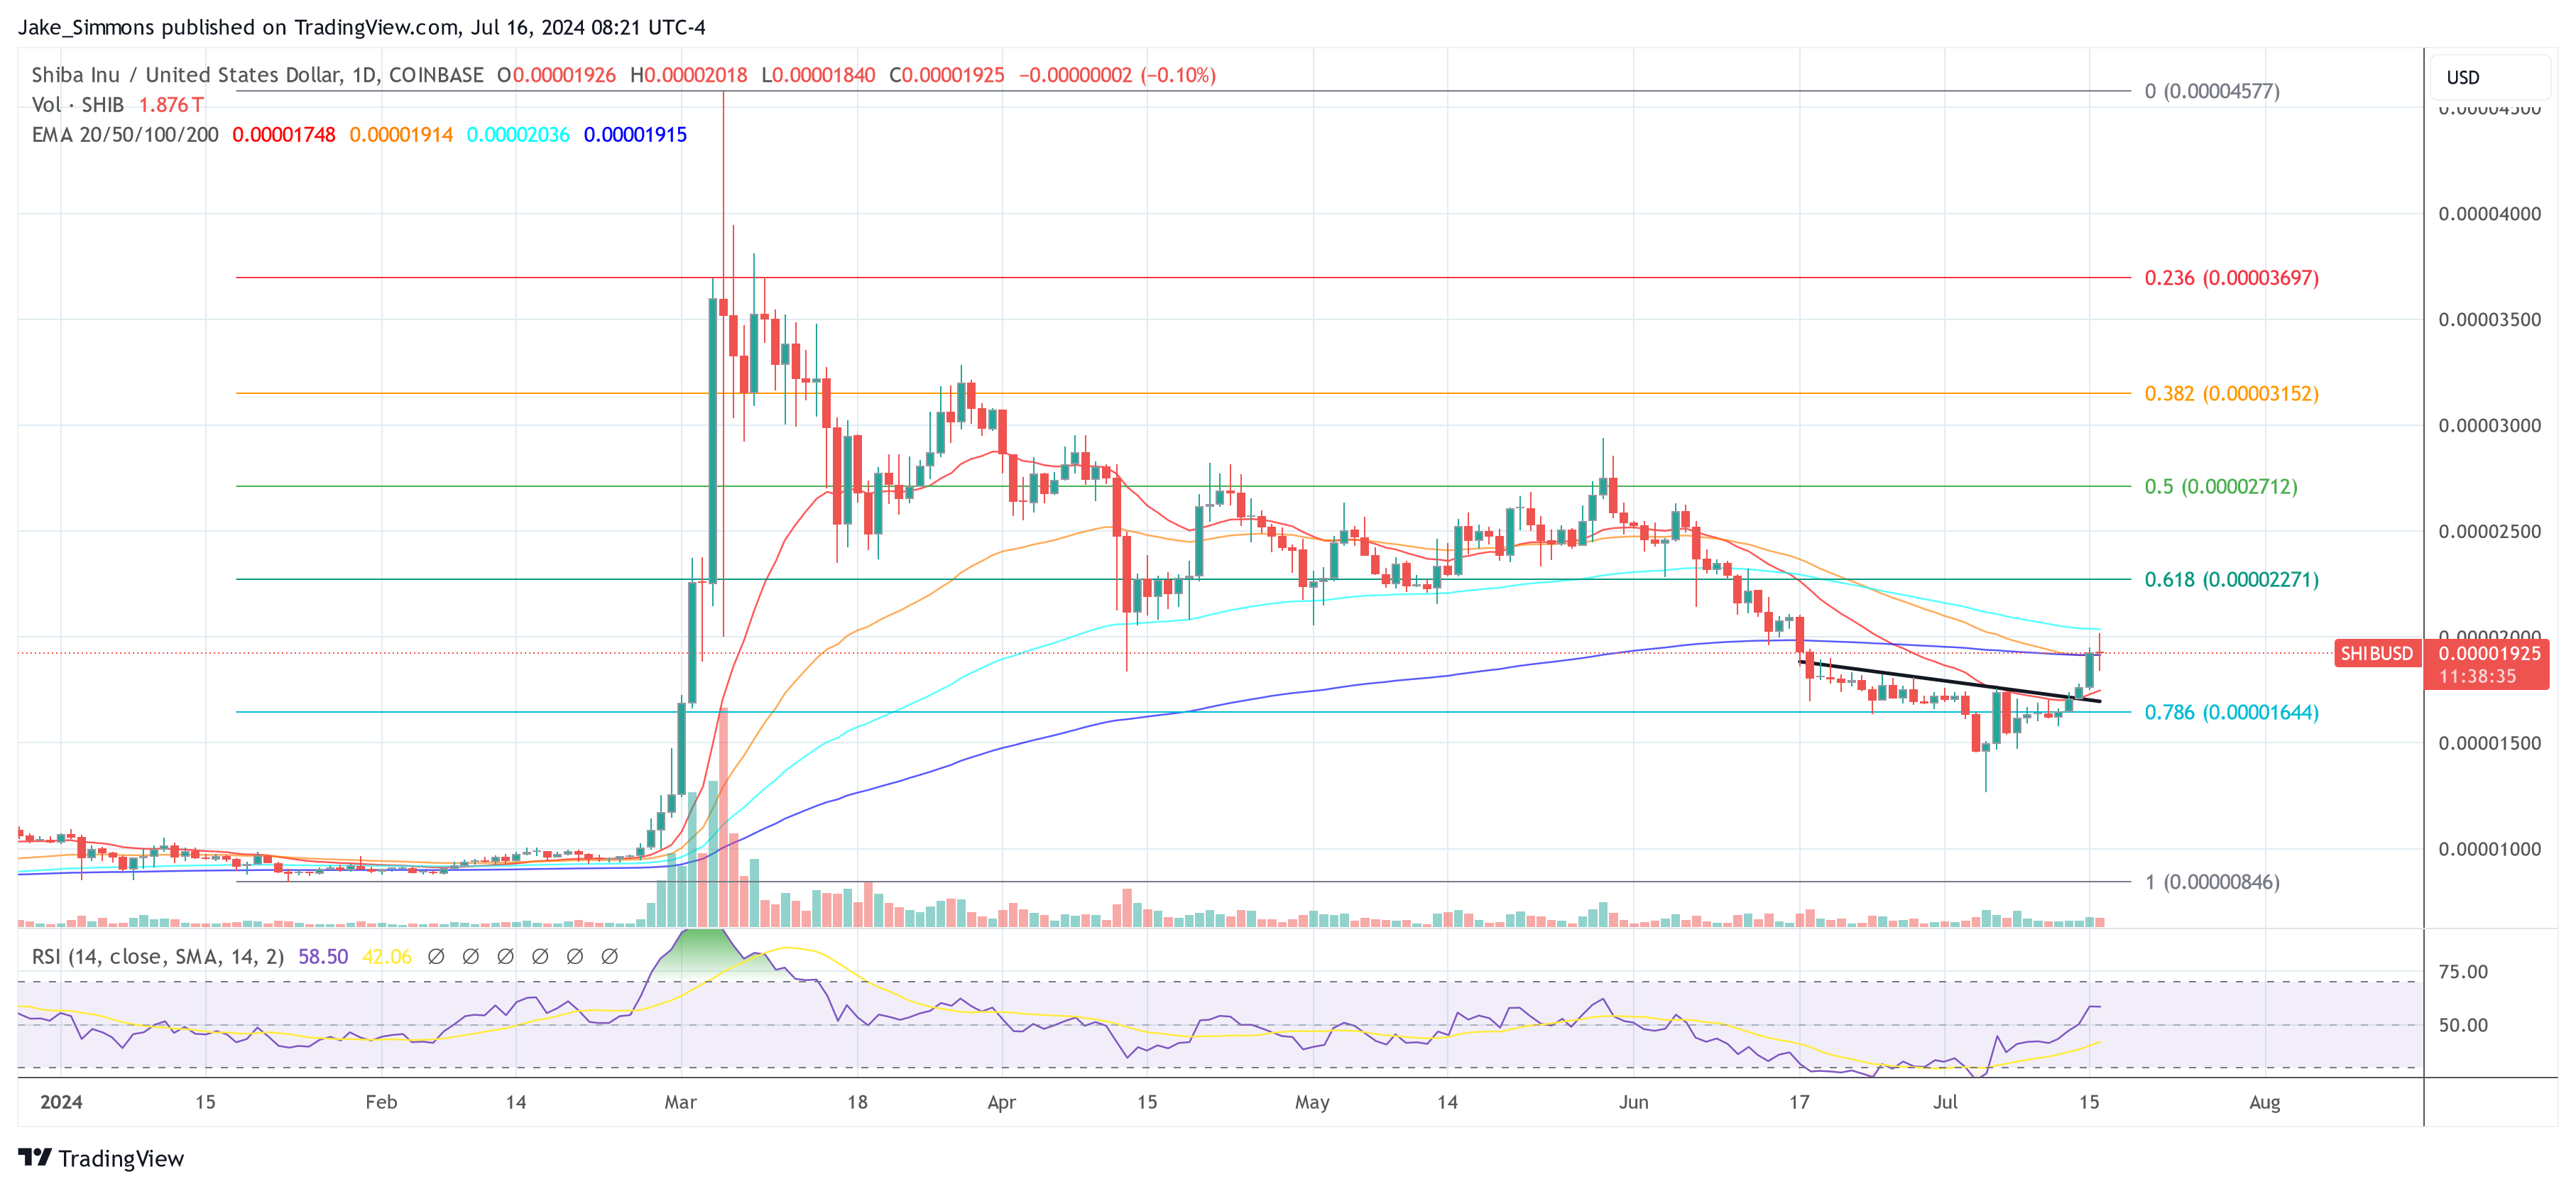
At press time, SHIB traded at $0.00001925.