Mantra (OM) Price Predictions to Watch Following Recent ATH

TL;DR
- Mantra (OM) reached a new all-time high of over $1.30, with a market cap surpassing $1 billion.
- Analysts are bullish, envisioning targets of up to $5.

Reaching a New Peak
The second-largest RWA cryptocurrency in terms of total market capitalization – Mantra (OM) – continues to impress industry participants with its price rally. It tapped a new all-time high of over $1.30 today (July 16) after experiencing a 15% daily increase. The surge on a monthly scale is almost 70%, while on a yearly basis, it is a staggering 5,000%.

Meanwhile, OM’s market cap surpassed the $1 billion mark for the first time ever, making it the 80th-largest cryptocurrency.
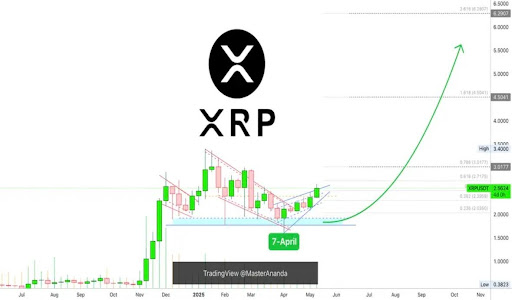
Numerous analysts believe the token is yet to fly to new dimensions. The X user Smith noted the breakout of a typical “cup and handle” pattern on OM’s price chart, envisioning a short-term target of $1.38 and a long-term one of over $5.
“One of the best RWA crypto projects right now,” the trader argued.
The aforementioned pattern is characterized by a distinct U-shaped “cup” followed by a small consolidation period resembling a “handle.” A breakout occurs when the valuation soars above the resistance level formed by the handle.
Crypto Tony chipped in, too, claiming they have hopped on the bandwagon as an investor when OM’s price reached $1.05 last week.
One analyst who correctly predicted the asset’s rally is AltCryptoTalk. Earlier this month, the crypto enthusiast claimed that OM could hit the $1.2 mark once breaking above the $1.05 resistance level.
Indicators Flashing the Buy Signal
Besides bullish analysts, certain OM metrics also suggest that the asset’s valuation is poised for further gains. One example is the MACD (Moving Average Convergence Divergence) that identifies changes in the strength, momentum, direction, and duration of the price.
The analysis tool is calculated using two moving averages: short-term (usually 12-period) and long-term (usually 26-period). If the MACD line crosses above the signal line, it might offer a buying opportunity. TradingView data shows this is the case as of the moment.
The charting platform estimated that 13 additional moving averages are currently flashing the buy signal, while only one (Ichimoku Base Line) is in the neutral zone.
The post Mantra (OM) Price Predictions to Watch Following Recent ATH appeared first on CryptoPotato.